
|
Wuxi DK Electronic Materials Co., Ltd. (300842.Sz) DCF -Bewertung |
Fully Editable: Tailor To Your Needs In Excel Or Sheets
Professional Design: Trusted, Industry-Standard Templates
Investor-Approved Valuation Models
MAC/PC Compatible, Fully Unlocked
No Expertise Is Needed; Easy To Follow
Wuxi DK Electronic Materials Co.,Ltd. (300842.SZ) Bundle
Möchten Sie den inneren Wert von Wuxi DK Electronic Materials Co., Ltd., bestimmen? Unser DCF-Taschenrechner (300842SZ) integriert reale Daten mit umfassenden Anpassungsfunktionen, sodass Sie Prognosen verfeinern und fundiertere Investitionsentscheidungen treffen können.
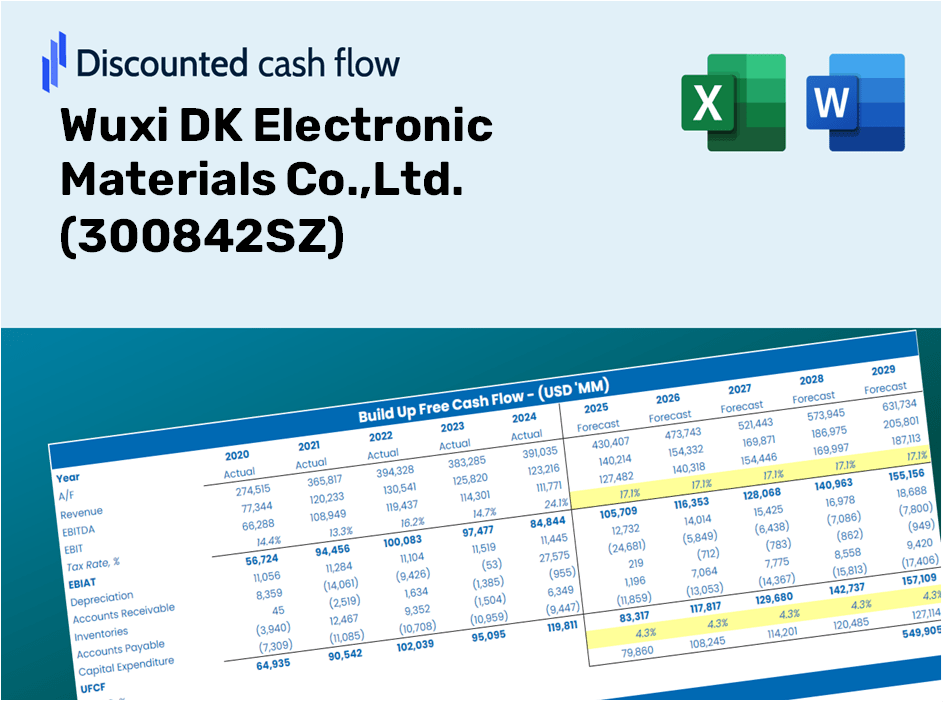
Discounted Cash Flow (DCF) - (USD MM)
| Year | AY1 2020 |
AY2 2021 |
AY3 2022 |
AY4 2023 |
AY5 2024 |
FY1 2025 |
FY2 2026 |
FY3 2027 |
FY4 2028 |
FY5 2029 |
|---|---|---|---|---|---|---|---|---|---|---|
| Revenue | 1,581.5 | 2,814.5 | 3,766.7 | 9,602.8 | 15,350.6 | 25,775.3 | 43,279.6 | 72,671.2 | 122,022.9 | 204,889.9 |
| Revenue Growth, % | 0 | 77.96 | 33.83 | 154.94 | 59.85 | 67.91 | 67.91 | 67.91 | 67.91 | 67.91 |
| EBITDA | 84.2 | 105.4 | 97.9 | 555.4 | 661.4 | 1,121.8 | 1,883.6 | 3,162.8 | 5,310.7 | 8,917.3 |
| EBITDA, % | 5.32 | 3.75 | 2.6 | 5.78 | 4.31 | 4.35 | 4.35 | 4.35 | 4.35 | 4.35 |
| Depreciation | 6.3 | 7.8 | 12.8 | 18.5 | 29.6 | 72.1 | 121.1 | 203.4 | 341.5 | 573.4 |
| Depreciation, % | 0.39682 | 0.27613 | 0.34092 | 0.19292 | 0.1926 | 0.27988 | 0.27988 | 0.27988 | 0.27988 | 0.27988 |
| EBIT | 77.9 | 97.7 | 85.1 | 536.9 | 631.8 | 1,049.7 | 1,762.5 | 2,959.4 | 4,969.2 | 8,343.9 |
| EBIT, % | 4.93 | 3.47 | 2.26 | 5.59 | 4.12 | 4.07 | 4.07 | 4.07 | 4.07 | 4.07 |
| Total Cash | 334.6 | 353.1 | 913.4 | 1,839.8 | 2,034.3 | 4,658.4 | 7,821.9 | 13,133.9 | 22,053.2 | 37,029.7 |
| Total Cash, percent | .0 | .0 | .0 | .0 | .0 | .0 | .0 | .0 | .0 | .0 |
| Account Receivables | 959.9 | 1,263.8 | 1,633.4 | 3,734.8 | 4,535.1 | 11,207.2 | 18,818.1 | 31,597.7 | 53,056.1 | 89,087.0 |
| Account Receivables, % | 60.7 | 44.9 | 43.37 | 38.89 | 29.54 | 43.48 | 43.48 | 43.48 | 43.48 | 43.48 |
| Inventories | 197.5 | 368.1 | 362.4 | 602.2 | 442.8 | 2,285.9 | 3,838.3 | 6,444.9 | 10,821.6 | 18,170.7 |
| Inventories, % | 12.49 | 13.08 | 9.62 | 6.27 | 2.88 | 8.87 | 8.87 | 8.87 | 8.87 | 8.87 |
| Accounts Payable | 48.3 | 163.4 | 781.0 | 154.9 | 2,611.8 | 2,485.8 | 4,173.9 | 7,008.4 | 11,767.9 | 19,759.7 |
| Accounts Payable, % | 3.05 | 5.8 | 20.73 | 1.61 | 17.01 | 9.64 | 9.64 | 9.64 | 9.64 | 9.64 |
| Capital Expenditure | -34.9 | -85.2 | -85.6 | -124.6 | -149.1 | -504.0 | -846.2 | -1,420.9 | -2,385.9 | -4,006.2 |
| Capital Expenditure, % | -2.21 | -3.03 | -2.27 | -1.3 | -0.97114 | -1.96 | -1.96 | -1.96 | -1.96 | -1.96 |
| Tax Rate, % | 1.31 | 1.31 | 1.31 | 1.31 | 1.31 | 1.31 | 1.31 | 1.31 | 1.31 | 1.31 |
| EBITAT | 68.0 | 91.2 | 43.9 | 498.7 | 623.5 | 889.9 | 1,494.2 | 2,509.0 | 4,212.8 | 7,073.8 |
| Depreciation | ||||||||||
| Changes in Account Receivables | ||||||||||
| Changes in Inventories | ||||||||||
| Changes in Accounts Payable | ||||||||||
| Capital Expenditure | ||||||||||
| UFCF | -1,069.7 | -345.6 | 224.8 | -2,574.6 | 2,319.9 | -8,183.0 | -6,706.1 | -11,260.2 | -18,907.1 | -31,747.2 |
| WACC, % | 11.79 | 11.89 | 11.21 | 11.88 | 11.98 | 11.75 | 11.75 | 11.75 | 11.75 | 11.75 |
| PV UFCF | ||||||||||
| SUM PV UFCF | -51,101.7 | |||||||||
| Long Term Growth Rate, % | 2.00 | |||||||||
| Free cash flow (T + 1) | -32,382 | |||||||||
| Terminal Value | -332,124 | |||||||||
| Present Terminal Value | -190,574 | |||||||||
| Enterprise Value | -241,675 | |||||||||
| Net Debt | -5 | |||||||||
| Equity Value | -241,670 | |||||||||
| Diluted Shares Outstanding, MM | 144 | |||||||||
| Equity Value Per Share | -1,678.44 |
Benefits You Will Receive
- Authentic Wuxi DK Financial Data: Pre-filled with Wuxi DK’s historical and forecasted financial information for accurate assessments.
- Fully Customizable Template: Easily adjust key parameters such as revenue growth, WACC, and EBITDA percentage.
- Instant Calculations: View the intrinsic value of Wuxi DK update in real-time as you make changes.
- Professional Valuation Tool: Tailored for investors, analysts, and consultants aiming for precise DCF evaluations.
- User-Friendly Interface: Intuitive layout and clear guidelines suitable for all levels of expertise.
Key Features
- Comprehensive DCF Calculator: Offers both unlevered and levered DCF valuation models tailored for Wuxi DK Electronic Materials Co., Ltd. (300842SZ).
- WACC Calculator: Pre-configured Weighted Average Cost of Capital sheet with adjustable parameters for customized analysis.
- Customizable Forecast Assumptions: Easily adjust growth rates, capital spending, and discount rates to fit your analysis.
- Integrated Financial Ratios: Evaluate profitability, leverage, and efficiency ratios specifically for Wuxi DK Electronic Materials Co., Ltd. (300842SZ).
- Interactive Dashboard and Charts: Visual displays summarize essential valuation metrics for straightforward interpretation.
How It Works
- Step 1: Download the Excel file.
- Step 2: Review the pre-filled data for Wuxi DK Electronic Materials Co., Ltd. (300842SZ) (historical and projected).
- Step 3: Modify key assumptions (highlighted in yellow) according to your analysis.
- Step 4: Observe the automatic updates for the intrinsic value of Wuxi DK Electronic Materials Co., Ltd. (300842SZ).
- Step 5: Utilize the results for making investment decisions or for reporting purposes.
Why Choose Wuxi DK Electronic Materials Co., Ltd. (300842SZ)?
- Engineered for Experts: A sophisticated tool utilized by industry analysts, CFOs, and consultants.
- Accurate Data Insights: Historical and projected financial data for Wuxi DK pre-loaded for reliability.
- Flexible Scenario Analysis: Effortlessly test various forecasts and assumptions.
- Comprehensive Outputs: Automatically computes intrinsic value, NPV, and essential performance metrics.
- User-Friendly Interface: Step-by-step guidance ensures a smooth experience throughout the process.
Who Should Utilize Our Services?
- Individual Investors: Gain insights to make informed decisions on investing in Wuxi DK Electronic Materials Co., Ltd. (300842SZ).
- Financial Analysts: Enhance your valuation methods with comprehensive financial models tailored for Wuxi DK (300842SZ).
- Consultants: Provide clients with expert valuation assessments of Wuxi DK (300842SZ) efficiently and accurately.
- Business Owners: Analyze the valuation approaches used for major companies like Wuxi DK (300842SZ) to inform your business strategies.
- Finance Students: Master valuation techniques through real-world applications involving Wuxi DK (300842SZ) data and scenarios.
Contents of the Template
- Preloaded Wuxi DK Data: Historical and projected financial metrics, including revenue, EBIT, and capital expenditures.
- DCF and WACC Models: Professional-grade worksheets for determining intrinsic value and Weighted Average Cost of Capital.
- Editable Inputs: Yellow-highlighted cells for customizing revenue growth, tax rates, and discount rates.
- Financial Statements: Detailed annual and quarterly financial reports for in-depth analysis.
- Key Ratios: Metrics for profitability, leverage, and efficiency to assess performance.
- Dashboard and Charts: Visual representations of valuation results and underlying assumptions.
Disclaimer
All information, articles, and product details provided on this website are for general informational and educational purposes only. We do not claim any ownership over, nor do we intend to infringe upon, any trademarks, copyrights, logos, brand names, or other intellectual property mentioned or depicted on this site. Such intellectual property remains the property of its respective owners, and any references here are made solely for identification or informational purposes, without implying any affiliation, endorsement, or partnership.
We make no representations or warranties, express or implied, regarding the accuracy, completeness, or suitability of any content or products presented. Nothing on this website should be construed as legal, tax, investment, financial, medical, or other professional advice. In addition, no part of this site—including articles or product references—constitutes a solicitation, recommendation, endorsement, advertisement, or offer to buy or sell any securities, franchises, or other financial instruments, particularly in jurisdictions where such activity would be unlawful.
All content is of a general nature and may not address the specific circumstances of any individual or entity. It is not a substitute for professional advice or services. Any actions you take based on the information provided here are strictly at your own risk. You accept full responsibility for any decisions or outcomes arising from your use of this website and agree to release us from any liability in connection with your use of, or reliance upon, the content or products found herein.