
|
Jiangsu Toland Alloy Co., Ltd (300855.SZ) DCF -Bewertung |
Fully Editable: Tailor To Your Needs In Excel Or Sheets
Professional Design: Trusted, Industry-Standard Templates
Investor-Approved Valuation Models
MAC/PC Compatible, Fully Unlocked
No Expertise Is Needed; Easy To Follow
Jiangsu ToLand Alloy Co.,Ltd (300855.SZ) Bundle
Verbessern Sie Ihre Anlagestrategien mit dem DCF -Taschenrechner (300855SZ)! Erforschen Sie authentische Finanzdaten von Jiangsu Toland Alloy Co., Ltd, stellen Sie Wachstumsprognosen und -kosten an und beobachten Sie sofort, wie diese Modifikationen den inneren Wert von (300855SZ) beeinflussen.
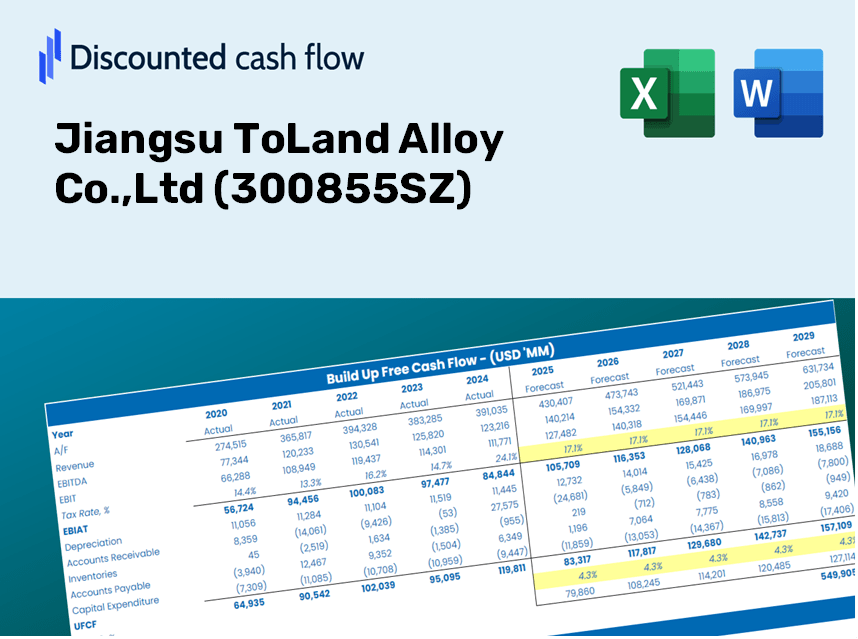
Discounted Cash Flow (DCF) - (USD MM)
| Year | AY1 2020 |
AY2 2021 |
AY3 2022 |
AY4 2023 |
AY5 2024 |
FY1 2025 |
FY2 2026 |
FY3 2027 |
FY4 2028 |
FY5 2029 |
|---|---|---|---|---|---|---|---|---|---|---|
| Revenue | 546.3 | 697.9 | 1,032.4 | 1,384.6 | 1,257.7 | 1,574.1 | 1,970.1 | 2,465.7 | 3,086.0 | 3,862.3 |
| Revenue Growth, % | 0 | 27.73 | 47.93 | 34.12 | -9.16 | 25.16 | 25.16 | 25.16 | 25.16 | 25.16 |
| EBITDA | 145.1 | 213.9 | 296.6 | 418.9 | 375.9 | 459.9 | 575.6 | 720.4 | 901.7 | 1,128.5 |
| EBITDA, % | 26.56 | 30.66 | 28.73 | 30.25 | 29.89 | 29.22 | 29.22 | 29.22 | 29.22 | 29.22 |
| Depreciation | 35.3 | 35.9 | 31.6 | 50.8 | 74.5 | 76.3 | 95.6 | 119.6 | 149.7 | 187.3 |
| Depreciation, % | 6.46 | 5.14 | 3.06 | 3.67 | 5.92 | 4.85 | 4.85 | 4.85 | 4.85 | 4.85 |
| EBIT | 109.8 | 178.0 | 265.0 | 368.1 | 301.5 | 383.6 | 480.1 | 600.8 | 752.0 | 941.1 |
| EBIT, % | 20.1 | 25.51 | 25.67 | 26.59 | 23.97 | 24.37 | 24.37 | 24.37 | 24.37 | 24.37 |
| Total Cash | 539.2 | 489.6 | 532.7 | 218.2 | 313.0 | 821.9 | 1,028.7 | 1,287.5 | 1,611.4 | 2,016.7 |
| Total Cash, percent | .0 | .0 | .0 | .0 | .0 | .0 | .0 | .0 | .0 | .0 |
| Account Receivables | 113.7 | 105.1 | 233.5 | 410.5 | 390.9 | 375.3 | 469.7 | 587.9 | 735.8 | 920.9 |
| Account Receivables, % | 20.82 | 15.05 | 22.62 | 29.65 | 31.08 | 23.84 | 23.84 | 23.84 | 23.84 | 23.84 |
| Inventories | 192.9 | 319.8 | 394.9 | 462.4 | 541.3 | 616.5 | 771.6 | 965.7 | 1,208.6 | 1,512.7 |
| Inventories, % | 35.32 | 45.82 | 38.26 | 33.39 | 43.03 | 39.17 | 39.17 | 39.17 | 39.17 | 39.17 |
| Accounts Payable | 22.6 | 39.0 | 152.7 | 204.8 | 115.2 | 152.6 | 191.0 | 239.0 | 299.2 | 374.4 |
| Accounts Payable, % | 4.14 | 5.59 | 14.79 | 14.79 | 9.16 | 9.69 | 9.69 | 9.69 | 9.69 | 9.69 |
| Capital Expenditure | -30.8 | -182.7 | -250.6 | -346.3 | -110.2 | -282.9 | -354.0 | -443.1 | -554.6 | -694.1 |
| Capital Expenditure, % | -5.63 | -26.18 | -24.27 | -25.01 | -8.76 | -17.97 | -17.97 | -17.97 | -17.97 | -17.97 |
| Tax Rate, % | 11.58 | 11.58 | 11.58 | 11.58 | 11.58 | 11.58 | 11.58 | 11.58 | 11.58 | 11.58 |
| EBITAT | 96.4 | 155.7 | 239.5 | 324.2 | 266.5 | 339.1 | 424.4 | 531.2 | 664.9 | 832.1 |
| Depreciation | ||||||||||
| Changes in Account Receivables | ||||||||||
| Changes in Inventories | ||||||||||
| Changes in Accounts Payable | ||||||||||
| Capital Expenditure | ||||||||||
| UFCF | -183.1 | -92.8 | -69.5 | -163.8 | 82.1 | 110.3 | -45.2 | -56.5 | -70.7 | -88.5 |
| WACC, % | 4.64 | 4.64 | 4.64 | 4.64 | 4.64 | 4.64 | 4.64 | 4.64 | 4.64 | 4.64 |
| PV UFCF | ||||||||||
| SUM PV UFCF | -114.7 | |||||||||
| Long Term Growth Rate, % | 3.50 | |||||||||
| Free cash flow (T + 1) | -92 | |||||||||
| Terminal Value | -8,042 | |||||||||
| Present Terminal Value | -6,411 | |||||||||
| Enterprise Value | -6,525 | |||||||||
| Net Debt | -196 | |||||||||
| Equity Value | -6,329 | |||||||||
| Diluted Shares Outstanding, MM | 393 | |||||||||
| Equity Value Per Share | -16.12 |
What You Will Receive
- Genuine Jiangsu ToLand Alloy Data: Preloaded financial information – encompassing everything from revenue to EBIT – based on actual and projected metrics.
- Comprehensive Customization: Modify all essential parameters (yellow cells) such as WACC, growth rates, and tax percentages.
- Real-Time Valuation Adjustments: Automatic recalculations to evaluate the influence of changes on Jiangsu ToLand Alloy’s fair value.
- Flexible Excel Template: Designed for easy modifications, scenario analysis, and detailed forecasts.
- Efficient and Precise: Avoid the hassle of building models from the ground up while ensuring accuracy and adaptability.
Key Features
- 🔍 Real-Life 300855SZ Financials: Pre-filled historical and projected data for Jiangsu ToLand Alloy Co., Ltd.
- ✏️ Fully Customizable Inputs: Modify all essential parameters (yellow cells) such as WACC, growth %, and tax rates.
- 📊 Professional DCF Valuation: Built-in formulas determine Jiangsu ToLand's intrinsic value using the Discounted Cash Flow method.
- ⚡ Instant Results: Visualize Jiangsu ToLand's valuation instantly after input adjustments.
- Scenario Analysis: Evaluate and compare outcomes for multiple financial assumptions side-by-side.
How It Works
- Step 1: Download the Excel spreadsheet.
- Step 2: Examine the pre-filled financial data and projections for Jiangsu ToLand Alloy Co., Ltd (300855SZ).
- Step 3: Adjust key inputs such as revenue growth, WACC, and tax rates (highlighted cells).
- Step 4: Observe the DCF model update in real-time as you modify the assumptions.
- Step 5: Evaluate the results and leverage the findings for your investment strategies.
Why Opt for This Tool?
- Designed for Industry Experts: A sophisticated resource tailored for analysts, CFOs, and consultants.
- Accurate Data: Preloaded historical and projected financials for Jiangsu ToLand Alloy Co., Ltd (300855SZ) ensure precision.
- Flexible Scenario Analysis: Effortlessly model various forecasts and assumptions.
- Insightful Results: Instantly computes intrinsic value, NPV, and other essential metrics.
- User-Friendly: Step-by-step guidance helps you navigate through the calculations seamlessly.
Who Should Use This Product?
- Investors: Evaluate the valuation of Jiangsu ToLand Alloy Co., Ltd (300855SZ) before making investment decisions.
- CFOs and Financial Analysts: Enhance efficiency in valuation methodologies and validate financial projections.
- Startup Founders: Gain insights into the valuation processes of established firms like Jiangsu ToLand Alloy Co., Ltd (300855SZ).
- Consultants: Provide clients with expert valuation analyses and comprehensive reports.
- Students and Educators: Utilize authentic market data to learn and teach effective valuation strategies.
Contents of the Template
- Historical Data: Contains past financial performance and baseline forecasts for Jiangsu ToLand Alloy Co., Ltd (300855SZ).
- DCF and Levered DCF Models: Comprehensive templates for calculating the intrinsic value of Jiangsu ToLand Alloy Co., Ltd (300855SZ).
- WACC Sheet: Pre-calculated metrics for the Weighted Average Cost of Capital.
- Editable Inputs: Adjust key parameters such as growth rates, EBITDA percentages, and CAPEX assumptions.
- Quarterly and Annual Statements: A detailed overview of Jiangsu ToLand Alloy Co., Ltd (300855SZ)'s financials.
- Interactive Dashboard: Dynamic visualization of valuation outcomes and forecasts.
Disclaimer
All information, articles, and product details provided on this website are for general informational and educational purposes only. We do not claim any ownership over, nor do we intend to infringe upon, any trademarks, copyrights, logos, brand names, or other intellectual property mentioned or depicted on this site. Such intellectual property remains the property of its respective owners, and any references here are made solely for identification or informational purposes, without implying any affiliation, endorsement, or partnership.
We make no representations or warranties, express or implied, regarding the accuracy, completeness, or suitability of any content or products presented. Nothing on this website should be construed as legal, tax, investment, financial, medical, or other professional advice. In addition, no part of this site—including articles or product references—constitutes a solicitation, recommendation, endorsement, advertisement, or offer to buy or sell any securities, franchises, or other financial instruments, particularly in jurisdictions where such activity would be unlawful.
All content is of a general nature and may not address the specific circumstances of any individual or entity. It is not a substitute for professional advice or services. Any actions you take based on the information provided here are strictly at your own risk. You accept full responsibility for any decisions or outcomes arising from your use of this website and agree to release us from any liability in connection with your use of, or reliance upon, the content or products found herein.