
|
Sharetronic Data Technology Co., Ltd. (300857.sz) DCF -Bewertung |
Fully Editable: Tailor To Your Needs In Excel Or Sheets
Professional Design: Trusted, Industry-Standard Templates
Investor-Approved Valuation Models
MAC/PC Compatible, Fully Unlocked
No Expertise Is Needed; Easy To Follow
Sharetronic Data Technology Co., Ltd. (300857.SZ) Bundle
Bewerten Sie die finanziellen Aussichten von Sharetronic Data Technology Co., Ltd. (300857SZ) wie ein Experte! Dieser DCF-Taschenrechner (300857SZ) bietet vorgepopulierte Finanzdaten und bietet vollständige Flexibilität, um das Umsatzwachstum, WACC, Margen und andere kritische Annahmen zu ändern, um sich an Ihren Projektionen anzupassen.
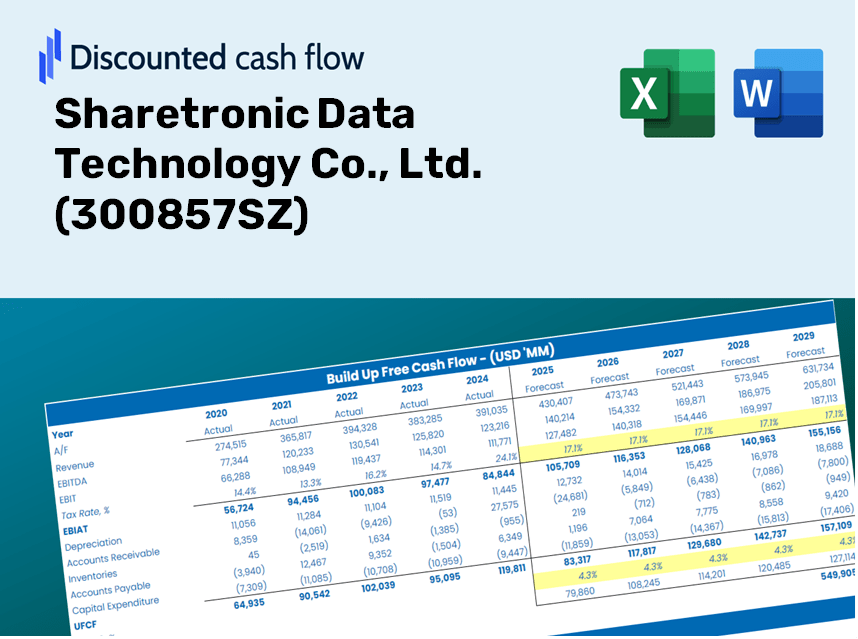
Discounted Cash Flow (DCF) - (USD MM)
| Year | AY1 2020 |
AY2 2021 |
AY3 2022 |
AY4 2023 |
AY5 2024 |
FY1 2025 |
FY2 2026 |
FY3 2027 |
FY4 2028 |
FY5 2029 |
|---|---|---|---|---|---|---|---|---|---|---|
| Revenue | 2,249.0 | 2,959.9 | 3,148.3 | 4,657.8 | 7,409.8 | 10,096.0 | 13,755.9 | 18,742.6 | 25,536.9 | 34,794.3 |
| Revenue Growth, % | 0 | 31.61 | 6.37 | 47.95 | 59.08 | 36.25 | 36.25 | 36.25 | 36.25 | 36.25 |
| EBITDA | 140.9 | 167.3 | 190.4 | 394.2 | 901.6 | 779.3 | 1,061.8 | 1,446.8 | 1,971.2 | 2,685.8 |
| EBITDA, % | 6.26 | 5.65 | 6.05 | 8.46 | 12.17 | 7.72 | 7.72 | 7.72 | 7.72 | 7.72 |
| Depreciation | 28.2 | 40.1 | 58.5 | 67.0 | 84.2 | 142.2 | 193.8 | 264.0 | 359.7 | 490.1 |
| Depreciation, % | 1.25 | 1.36 | 1.86 | 1.44 | 1.14 | 1.41 | 1.41 | 1.41 | 1.41 | 1.41 |
| EBIT | 112.7 | 127.2 | 131.9 | 327.1 | 817.4 | 637.1 | 868.1 | 1,182.8 | 1,611.5 | 2,195.7 |
| EBIT, % | 5.01 | 4.3 | 4.19 | 7.02 | 11.03 | 6.31 | 6.31 | 6.31 | 6.31 | 6.31 |
| Total Cash | 564.7 | 472.7 | 551.6 | 1,817.5 | 1,577.4 | 2,401.0 | 3,271.3 | 4,457.2 | 6,073.0 | 8,274.6 |
| Total Cash, percent | .0 | .0 | .0 | .0 | .0 | .0 | .0 | .0 | .0 | .0 |
| Account Receivables | 524.8 | 673.6 | 703.4 | 884.7 | 1,583.0 | 2,196.7 | 2,993.0 | 4,078.1 | 5,556.4 | 7,570.6 |
| Account Receivables, % | 23.33 | 22.76 | 22.34 | 18.99 | 21.36 | 21.76 | 21.76 | 21.76 | 21.76 | 21.76 |
| Inventories | 491.3 | 640.9 | 830.2 | 1,315.2 | 1,890.3 | 2,496.0 | 3,400.9 | 4,633.7 | 6,313.5 | 8,602.2 |
| Inventories, % | 21.85 | 21.65 | 26.37 | 28.24 | 25.51 | 24.72 | 24.72 | 24.72 | 24.72 | 24.72 |
| Accounts Payable | 439.0 | 729.1 | 764.4 | 1,542.9 | 1,563.5 | 2,476.7 | 3,374.5 | 4,597.7 | 6,264.5 | 8,535.4 |
| Accounts Payable, % | 19.52 | 24.63 | 24.28 | 33.12 | 21.1 | 24.53 | 24.53 | 24.53 | 24.53 | 24.53 |
| Capital Expenditure | -194.6 | -152.4 | -74.4 | -149.0 | -749.5 | -595.2 | -811.0 | -1,105.0 | -1,505.6 | -2,051.4 |
| Capital Expenditure, % | -8.65 | -5.15 | -2.36 | -3.2 | -10.12 | -5.9 | -5.9 | -5.9 | -5.9 | -5.9 |
| Tax Rate, % | 11.91 | 11.91 | 11.91 | 11.91 | 11.91 | 11.91 | 11.91 | 11.91 | 11.91 | 11.91 |
| EBITAT | 103.8 | 124.1 | 123.3 | 296.8 | 720.0 | 588.6 | 802.0 | 1,092.7 | 1,488.8 | 2,028.5 |
| Depreciation | ||||||||||
| Changes in Account Receivables | ||||||||||
| Changes in Inventories | ||||||||||
| Changes in Accounts Payable | ||||||||||
| Capital Expenditure | ||||||||||
| UFCF | -639.8 | 3.6 | -76.4 | 326.9 | -1,198.1 | -170.7 | -618.6 | -842.9 | -1,148.5 | -1,564.8 |
| WACC, % | 10.18 | 10.19 | 10.18 | 10.18 | 10.18 | 10.18 | 10.18 | 10.18 | 10.18 | 10.18 |
| PV UFCF | ||||||||||
| SUM PV UFCF | -3,037.5 | |||||||||
| Long Term Growth Rate, % | 2.00 | |||||||||
| Free cash flow (T + 1) | -1,596 | |||||||||
| Terminal Value | -19,507 | |||||||||
| Present Terminal Value | -12,013 | |||||||||
| Enterprise Value | -15,050 | |||||||||
| Net Debt | 195 | |||||||||
| Equity Value | -15,246 | |||||||||
| Diluted Shares Outstanding, MM | 245 | |||||||||
| Equity Value Per Share | -62.16 |
What You Will Receive
- Authentic Sharetronic Data: Preloaded financials – encompassing revenue to EBIT – derived from actual and projected data.
- Comprehensive Customization: Modify all essential parameters (yellow cells) such as WACC, growth %, and tax rates.
- Instant Valuation Adjustments: Automatic recalculations to evaluate the effects of changes on Sharetronic’s fair value.
- Flexible Excel Template: Designed for quick modifications, scenario analysis, and detailed forecasting.
- Efficient and Accurate: Eliminate the need to build models from the ground up while ensuring precision and adaptability.
Core Features
- Customizable Forecast Inputs: Adjust essential factors such as revenue growth, EBITDA %, and capital investments.
- Instant DCF Valuation: Quickly computes intrinsic value, NPV, and other financial metrics.
- High-Precision Accuracy: Leverages real financial data from Sharetronic Data Technology Co., Ltd. for dependable valuation results.
- Simplified Scenario Analysis: Effortlessly evaluate different assumptions and analyze outcomes.
- Efficiency Booster: Remove the hassle of creating intricate valuation models from the ground up.
How It Operates
- Download the Template: Gain immediate access to the Excel-based Sharetronic DCF Calculator for [Symbol].
- Input Your Assumptions: Modify the yellow-highlighted cells to set growth rates, WACC, profit margins, and other variables.
- Instant Calculations: The model automatically recalculates Sharetronic's intrinsic value in real-time.
- Test Scenarios: Experiment with various assumptions to explore potential changes in valuation.
- Analyze and Decide: Leverage the results to inform your investment strategies or financial assessments.
Why Opt for Sharetronic's Services?
- Precision: Leveraging accurate financial data for reliable results.
- Adaptability: Empowering users to experiment with and adjust inputs as needed.
- Efficiency: Eliminate the complexity of creating a financial model from the ground up.
- High Quality: Crafted with the expertise and rigor expected at the CFO level.
- Intuitive Design: Simple to navigate, even for those new to financial modeling.
Who Should Utilize This Product?
- Investors: Accurately assess the fair value of Sharetronic Data Technology Co., Ltd. ([300857SZ]) prior to making investment choices.
- CFOs: Utilize a high-level DCF model for comprehensive financial reporting and analysis.
- Consultants: Efficiently modify the template for client valuation reports.
- Entrepreneurs: Acquire insights into the financial modeling practices of leading tech firms.
- Educators: Employ this tool as a resource for teaching valuation techniques.
Contents of the Template
- Preloaded Sharetronic Data: Historical and projected financial information, encompassing revenue, EBIT, and capital expenditures.
- DCF and WACC Models: Advanced templates for determining intrinsic value and Weighted Average Cost of Capital.
- Editable Inputs: Yellow-highlighted fields for modifying revenue growth, tax rates, and discount rates.
- Financial Statements: Detailed annual and quarterly financial reports for in-depth analysis.
- Key Ratios: Metrics for profitability, leverage, and efficiency to assess overall performance.
- Dashboard and Charts: Visual representations of valuation results and underlying assumptions.
Disclaimer
All information, articles, and product details provided on this website are for general informational and educational purposes only. We do not claim any ownership over, nor do we intend to infringe upon, any trademarks, copyrights, logos, brand names, or other intellectual property mentioned or depicted on this site. Such intellectual property remains the property of its respective owners, and any references here are made solely for identification or informational purposes, without implying any affiliation, endorsement, or partnership.
We make no representations or warranties, express or implied, regarding the accuracy, completeness, or suitability of any content or products presented. Nothing on this website should be construed as legal, tax, investment, financial, medical, or other professional advice. In addition, no part of this site—including articles or product references—constitutes a solicitation, recommendation, endorsement, advertisement, or offer to buy or sell any securities, franchises, or other financial instruments, particularly in jurisdictions where such activity would be unlawful.
All content is of a general nature and may not address the specific circumstances of any individual or entity. It is not a substitute for professional advice or services. Any actions you take based on the information provided here are strictly at your own risk. You accept full responsibility for any decisions or outcomes arising from your use of this website and agree to release us from any liability in connection with your use of, or reliance upon, the content or products found herein.