
|
Gewinner Medical Co., Ltd. (300888.sz) DCF -Bewertung |
Fully Editable: Tailor To Your Needs In Excel Or Sheets
Professional Design: Trusted, Industry-Standard Templates
Investor-Approved Valuation Models
MAC/PC Compatible, Fully Unlocked
No Expertise Is Needed; Easy To Follow
Winner Medical Co., Ltd. (300888.SZ) Bundle
Vereinfachen Sie die Gewinnerin Medical Co., Ltd. Bewertung mit diesem anpassbaren DCF -Taschenrechner! Mit Real Winner Medical Co., Ltd. Financials und einstellbaren Prognoseeingaben können Sie Szenarien testen und die Gewinnerin Medical Co., Ltd. in Minuten aufdecken.
What You Will Receive
- Authentic 300888SZ Financial Data: Pre-populated with Winner Medical's historical and projected figures for accurate analysis.
- Completely Customizable Template: Easily adjust essential inputs like revenue growth, WACC, and EBITDA %.
- Instant Calculations: Watch the intrinsic value of Winner Medical (300888SZ) update in real-time based on your modifications.
- Professional Valuation Tool: Crafted for investors, analysts, and consultants in search of reliable DCF results.
- User-Friendly Interface: Intuitive layout and straightforward instructions suitable for all skill levels.
Key Features
- Comprehensive DCF Calculator: Features detailed unlevered and levered DCF valuation models tailored for Winner Medical Co., Ltd. (300888SZ).
- WACC Calculator: Pre-configured Weighted Average Cost of Capital sheet with adjustable inputs for flexibility.
- Customizable Forecast Assumptions: Alter growth rates, capital expenditures, and discount rates as needed.
- Integrated Financial Ratios: Evaluate profitability, leverage, and efficiency ratios specific to Winner Medical Co., Ltd. (300888SZ).
- Interactive Dashboard and Charts: Visual representations that summarize critical valuation metrics for straightforward analysis.
How It Works
- Step 1: Download the prebuilt Excel template with Winner Medical Co., Ltd.'s (300888SZ) data included.
- Step 2: Review the pre-filled sheets to familiarize yourself with the key metrics.
- Step 3: Modify forecasts and assumptions directly in the editable yellow cells (WACC, growth, margins).
- Step 4: Immediately see the recalculated results, including Winner Medical Co., Ltd.'s (300888SZ) intrinsic value.
- Step 5: Use the outputs to make informed investment decisions or to generate reports.
Why Choose This Calculator for Winner Medical Co., Ltd. (300888SZ)?
- User-Friendly Interface: Perfect for both novices and seasoned professionals.
- Customizable Inputs: Effortlessly adjust parameters to suit your analysis needs.
- Real-Time Feedback: Observe immediate updates to Winner Medical’s valuation as you tweak the inputs.
- Pre-Loaded Data: Comes with Winner Medical’s actual financial metrics for quick and efficient analysis.
- Industry-Approved: Trusted by analysts and investors for making strategic decisions.
Who Can Benefit from This Product?
- Individual Investors: Gain insights to make well-informed decisions regarding investments in Winner Medical Co., Ltd. (300888SZ).
- Financial Analysts: Enhance valuation workflows with readily available financial models tailored for Winner Medical Co., Ltd. (300888SZ).
- Consultants: Provide clients with accurate and timely valuation analyses for Winner Medical Co., Ltd. (300888SZ).
- Business Owners: Learn how valuations of major players like Winner Medical Co., Ltd. (300888SZ) can inform your own business strategy.
- Finance Students: Study valuation methodologies using real data and scenarios from Winner Medical Co., Ltd. (300888SZ).
Contents of the Template
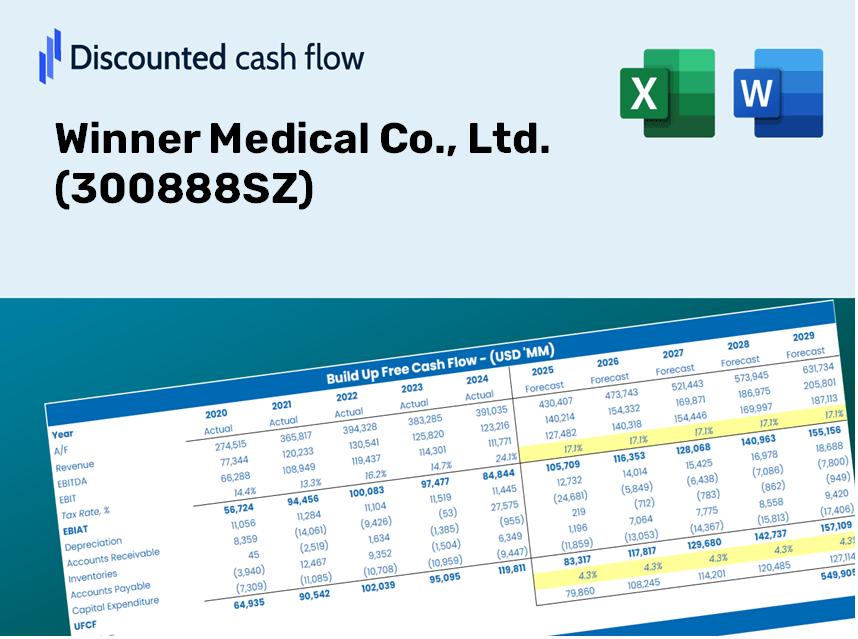
- Operating and Balance Sheet Data: Pre-filled historical data and forecasts for Winner Medical Co., Ltd. (300888SZ), including revenue, EBITDA, EBIT, and capital expenditures.
- WACC Calculation: A dedicated sheet for calculating the Weighted Average Cost of Capital (WACC), featuring parameters such as Beta, risk-free rate, and share price.
- DCF Valuation (Unlevered and Levered): Editable Discounted Cash Flow models illustrating intrinsic value with comprehensive calculations.
- Financial Statements: Pre-loaded financial statements (both annual and quarterly) to facilitate detailed analysis.
- Key Ratios: Includes essential profitability, leverage, and efficiency ratios for Winner Medical Co., Ltd. (300888SZ).
- Dashboard and Charts: Visual representations of valuation outputs and assumptions, designed for straightforward results analysis.
Disclaimer
All information, articles, and product details provided on this website are for general informational and educational purposes only. We do not claim any ownership over, nor do we intend to infringe upon, any trademarks, copyrights, logos, brand names, or other intellectual property mentioned or depicted on this site. Such intellectual property remains the property of its respective owners, and any references here are made solely for identification or informational purposes, without implying any affiliation, endorsement, or partnership.
We make no representations or warranties, express or implied, regarding the accuracy, completeness, or suitability of any content or products presented. Nothing on this website should be construed as legal, tax, investment, financial, medical, or other professional advice. In addition, no part of this site—including articles or product references—constitutes a solicitation, recommendation, endorsement, advertisement, or offer to buy or sell any securities, franchises, or other financial instruments, particularly in jurisdictions where such activity would be unlawful.
All content is of a general nature and may not address the specific circumstances of any individual or entity. It is not a substitute for professional advice or services. Any actions you take based on the information provided here are strictly at your own risk. You accept full responsibility for any decisions or outcomes arising from your use of this website and agree to release us from any liability in connection with your use of, or reliance upon, the content or products found herein.