
|
Ningbo Hengshuai Co., Ltd. (300969.SZ) DCF -Bewertung |
Fully Editable: Tailor To Your Needs In Excel Or Sheets
Professional Design: Trusted, Industry-Standard Templates
Investor-Approved Valuation Models
MAC/PC Compatible, Fully Unlocked
No Expertise Is Needed; Easy To Follow
NINGBO HENGSHUAI Co., LTD. (300969.SZ) Bundle
Unser (300969SZ) DCF -Taschenrechner für Genauigkeit entwickelt, ermöglicht es Sie, Ningbo Hengshuai Co., Ltd., zu bewerten. Bewertung unter Verwendung der tatsächlichen Finanzdaten, die vollständige Flexibilität bietet, um alle wesentlichen Parameter für erweiterte Projektionen zu ändern.
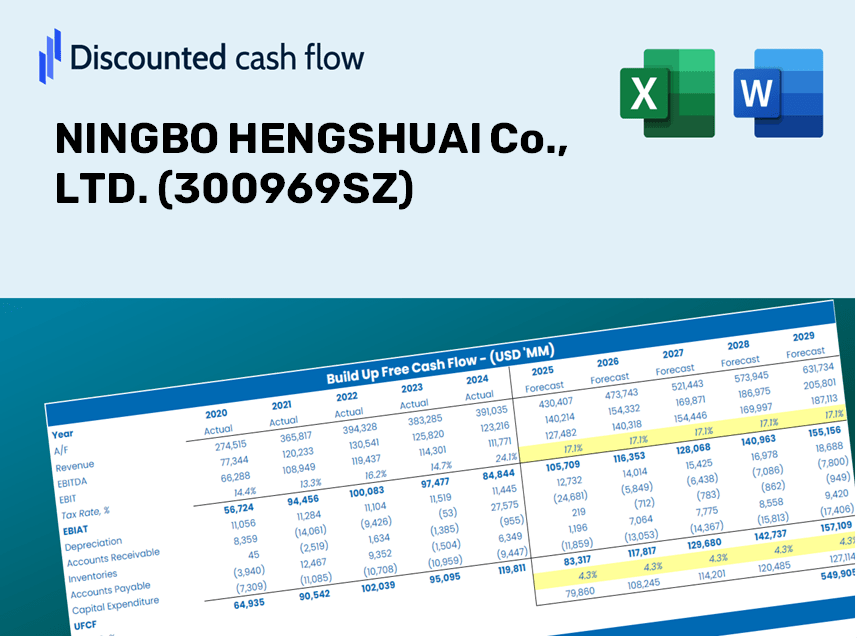
Discounted Cash Flow (DCF) - (USD MM)
| Year | AY1 2020 |
AY2 2021 |
AY3 2022 |
AY4 2023 |
AY5 2024 |
FY1 2025 |
FY2 2026 |
FY3 2027 |
FY4 2028 |
FY5 2029 |
|---|---|---|---|---|---|---|---|---|---|---|
| Revenue | 341.1 | 584.4 | 738.8 | 923.4 | 962.3 | 1,267.7 | 1,670.0 | 2,199.9 | 2,898.0 | 3,817.7 |
| Revenue Growth, % | 0 | 71.33 | 26.4 | 24.99 | 4.21 | 31.73 | 31.73 | 31.73 | 31.73 | 31.73 |
| EBITDA | 86.9 | 138.1 | 168.1 | 247.7 | 253.5 | 317.0 | 417.6 | 550.1 | 724.7 | 954.7 |
| EBITDA, % | 25.49 | 23.63 | 22.75 | 26.83 | 26.34 | 25.01 | 25.01 | 25.01 | 25.01 | 25.01 |
| Depreciation | 14.2 | 18.2 | 22.9 | 31.0 | 35.0 | 44.1 | 58.1 | 76.5 | 100.8 | 132.7 |
| Depreciation, % | 4.17 | 3.11 | 3.11 | 3.36 | 3.64 | 3.48 | 3.48 | 3.48 | 3.48 | 3.48 |
| EBIT | 72.7 | 119.9 | 145.1 | 216.7 | 218.5 | 272.9 | 359.5 | 473.6 | 624.0 | 822.0 |
| EBIT, % | 21.32 | 20.52 | 19.64 | 23.47 | 22.7 | 21.53 | 21.53 | 21.53 | 21.53 | 21.53 |
| Total Cash | 103.9 | 416.6 | 490.0 | 552.7 | 661.9 | 752.2 | 991.0 | 1,305.4 | 1,719.7 | 2,265.4 |
| Total Cash, percent | .0 | .0 | .0 | .0 | .0 | .0 | .0 | .0 | .0 | .0 |
| Account Receivables | 93.5 | 152.6 | 195.6 | 261.4 | 258.1 | 342.6 | 451.3 | 594.5 | 783.2 | 1,031.8 |
| Account Receivables, % | 27.4 | 26.12 | 26.48 | 28.3 | 26.83 | 27.03 | 27.03 | 27.03 | 27.03 | 27.03 |
| Inventories | 62.6 | 95.6 | 108.5 | 112.6 | 111.4 | 185.5 | 244.4 | 322.0 | 424.2 | 558.8 |
| Inventories, % | 18.36 | 16.36 | 14.69 | 12.19 | 11.58 | 14.64 | 14.64 | 14.64 | 14.64 | 14.64 |
| Accounts Payable | 93.1 | 109.2 | 182.8 | 245.2 | 98.2 | 272.5 | 358.9 | 472.9 | 622.9 | 820.6 |
| Accounts Payable, % | 27.29 | 18.69 | 24.74 | 26.55 | 10.21 | 21.49 | 21.49 | 21.49 | 21.49 | 21.49 |
| Capital Expenditure | -73.1 | -113.9 | -115.9 | -152.4 | -95.7 | -210.5 | -277.4 | -365.4 | -481.3 | -634.1 |
| Capital Expenditure, % | -21.42 | -19.49 | -15.69 | -16.5 | -9.94 | -16.61 | -16.61 | -16.61 | -16.61 | -16.61 |
| Tax Rate, % | 13.84 | 13.84 | 13.84 | 13.84 | 13.84 | 13.84 | 13.84 | 13.84 | 13.84 | 13.84 |
| EBITAT | 62.7 | 103.8 | 127.6 | 186.5 | 188.2 | 236.3 | 311.3 | 410.1 | 540.3 | 711.8 |
| Depreciation | ||||||||||
| Changes in Account Receivables | ||||||||||
| Changes in Inventories | ||||||||||
| Changes in Accounts Payable | ||||||||||
| Capital Expenditure | ||||||||||
| UFCF | -59.1 | -68.0 | 52.3 | 57.8 | -15.0 | 85.5 | 10.9 | 14.4 | 18.9 | 24.9 |
| WACC, % | 11.78 | 11.78 | 11.78 | 11.78 | 11.78 | 11.78 | 11.78 | 11.78 | 11.78 | 11.78 |
| PV UFCF | ||||||||||
| SUM PV UFCF | 121.9 | |||||||||
| Long Term Growth Rate, % | 4.00 | |||||||||
| Free cash flow (T + 1) | 26 | |||||||||
| Terminal Value | 333 | |||||||||
| Present Terminal Value | 191 | |||||||||
| Enterprise Value | 313 | |||||||||
| Net Debt | -335 | |||||||||
| Equity Value | 648 | |||||||||
| Diluted Shares Outstanding, MM | 80 | |||||||||
| Equity Value Per Share | 8.10 |
Benefits You Will Receive
- Pre-Filled Financial Model: Utilize NINGBO HENGSHUAI Co., LTD.'s (300969SZ) actual data for an accurate DCF valuation.
- Comprehensive Forecast Control: Modify revenue growth rates, profit margins, WACC, and other essential variables.
- Real-Time Calculations: Enjoy automatic updates that reflect changes instantly, providing immediate feedback.
- Professional-Grade Template: Access a polished Excel file crafted for sophisticated valuation tasks.
- Flexible and Reusable: Designed for adaptability, allowing for repeated utilization in detailed forecasting.
Key Features
- Comprehensive Historical Data: Access NINGBO HENGSHUAI Co., LTD.'s (300969SZ) financial statements and pre-filled projections.
- Customizable Parameters: Modify inputs such as WACC, tax rates, revenue growth, and EBITDA margins.
- Real-Time Valuation: Instantly see the recalculated intrinsic value for NINGBO HENGSHUAI Co., LTD. (300969SZ).
- Insightful Visualizations: Interactive dashboard charts reveal valuation outcomes and essential metrics.
- Designed for Precision: A professional-grade tool tailored for analysts, investors, and finance professionals.
How It Works
- Download: Obtain the ready-to-use Excel spreadsheet containing NINGBO HENGSHUAI Co., LTD.'s (300969SZ) financial data.
- Customize: Modify forecasts such as revenue growth, EBITDA percentage, and WACC to fit your analysis.
- Update Automatically: Watch as the intrinsic value and NPV calculations refresh in real-time.
- Test Scenarios: Develop multiple projections and instantly compare the resulting outcomes.
- Make Decisions: Leverage the valuation results to inform your investment strategy for NINGBO HENGSHUAI Co., LTD. (300969SZ).
Why Choose NINGBO HENGSHUAI Co., LTD. (300969SZ) Calculator?
- Designed for Experts: A sophisticated tool utilized by financial analysts, CFOs, and consultants.
- Accurate Data: NINGBO HENGSHUAI's historical and forecasted financials are preloaded for reliability.
- Versatile Scenario Analysis: Effortlessly test various projections and assumptions.
- Comprehensive Outputs: Automatically computes intrinsic value, NPV, and essential metrics.
- User-Friendly: Step-by-step guidance ensures a smooth experience throughout the calculation process.
Who Can Benefit from Our Services?
- Investors: Access precise estimates of NINGBO HENGSHUAI Co., LTD.'s (300969SZ) fair value to inform your investment choices.
- CFOs: Utilize our advanced financial models for comprehensive reporting and analysis.
- Consultants: Easily customize our templates for client valuation reports related to NINGBO HENGSHUAI Co., LTD. (300969SZ).
- Entrepreneurs: Discover financial modeling techniques employed by leading companies in the industry.
- Educators: Implement our resources in the classroom to illustrate various valuation methods.
Contents of the Template
- Comprehensive DCF Model: An editable template featuring detailed valuation calculations tailored for NINGBO HENGSHUAI Co., LTD. (300969SZ).
- Real-World Data: Historical and projected financials for NINGBO HENGSHUAI Co., LTD. (300969SZ) are preloaded for in-depth analysis.
- Customizable Parameters: Modify WACC, growth rates, and tax assumptions to explore different scenarios.
- Financial Statements: Complete annual and quarterly financial breakdowns to provide deeper insights.
- Key Ratios: Integrated analysis for assessing profitability, efficiency, and leverage.
- Dashboard with Visual Outputs: Includes charts and tables for clear, actionable insights.
Disclaimer
All information, articles, and product details provided on this website are for general informational and educational purposes only. We do not claim any ownership over, nor do we intend to infringe upon, any trademarks, copyrights, logos, brand names, or other intellectual property mentioned or depicted on this site. Such intellectual property remains the property of its respective owners, and any references here are made solely for identification or informational purposes, without implying any affiliation, endorsement, or partnership.
We make no representations or warranties, express or implied, regarding the accuracy, completeness, or suitability of any content or products presented. Nothing on this website should be construed as legal, tax, investment, financial, medical, or other professional advice. In addition, no part of this site—including articles or product references—constitutes a solicitation, recommendation, endorsement, advertisement, or offer to buy or sell any securities, franchises, or other financial instruments, particularly in jurisdictions where such activity would be unlawful.
All content is of a general nature and may not address the specific circumstances of any individual or entity. It is not a substitute for professional advice or services. Any actions you take based on the information provided here are strictly at your own risk. You accept full responsibility for any decisions or outcomes arising from your use of this website and agree to release us from any liability in connection with your use of, or reliance upon, the content or products found herein.