
|
Yihai Kerry Arawana Holdings Co., Ltd (300999.SZ) DCF -Bewertung |
Fully Editable: Tailor To Your Needs In Excel Or Sheets
Professional Design: Trusted, Industry-Standard Templates
Investor-Approved Valuation Models
MAC/PC Compatible, Fully Unlocked
No Expertise Is Needed; Easy To Follow
Yihai Kerry Arawana Holdings Co., Ltd (300999.SZ) Bundle
Sparen Sie Zeit und verbessern Sie die Präzision mit unserem DCF -Taschenrechner (300999SZ)! Mithilfe realer Daten von Yihai Kerry Arawana Holdings Co., Ltd und anpassbaren Annahmen können Sie Yihai Kerry Arawana wie einen erfahrenen Investor prognostizieren, analysieren und bewerten.
Benefits You Will Receive
- Accurate 300999SZ Financial Data: Pre-loaded with Yihai Kerry Arawana's historical and forecasted figures for detailed analysis.
- Completely Customizable Template: Effortlessly adjust essential inputs such as revenue growth, WACC, and EBITDA percentage.
- Instant Calculations: Observe real-time updates of Yihai Kerry Arawana's intrinsic value based on your modifications.
- Expert Valuation Tool: Tailored for investors, analysts, and consultants in pursuit of reliable DCF results.
- Intuitive Design: A straightforward layout and clear guidance suitable for users of all skill levels.
Key Features
- Customizable Forecast Variables: Adjust essential metrics such as revenue growth, EBITDA percentage, and capital expenditures.
- Instant DCF Valuation: Quickly computes intrinsic value, NPV, and additional financial metrics.
- Top-Tier Precision: Leverages Yihai Kerry Arawana's actual financial data for accurate valuation results.
- Simplified Scenario Analysis: Effortlessly explore various assumptions and evaluate different outcomes.
- Efficiency Booster: Remove the necessity of creating intricate valuation models from the ground up.
How It Works
- Step 1: Download the prebuilt Excel template featuring Yihai Kerry Arawana Holdings Co., Ltd's (300999SZ) data.
- Step 2: Navigate through the pre-filled sheets to familiarize yourself with the essential metrics.
- Step 3: Modify forecasts and assumptions in the editable yellow cells (WACC, growth, margins).
- Step 4: Instantly see the updated calculations, including Yihai Kerry Arawana Holdings Co., Ltd's (300999SZ) intrinsic value.
- Step 5: Make well-informed investment choices or create reports based on the results.
Why Choose This Calculator for Yihai Kerry Arawana Holdings Co., Ltd (300999SZ)?
- User-Friendly Interface: Perfect for both novices and seasoned professionals.
- Customizable Inputs: Adjust parameters easily to suit your analytical needs.
- Real-Time Valuation Updates: Witness instant changes in Yihai Kerry Arawana's valuation as you tweak the inputs.
- Pre-Configured Data: Comes equipped with Yihai Kerry Arawana's actual financial metrics for swift assessments.
- Relied Upon by Experts: A go-to tool for investors and analysts seeking to make well-informed choices.
Who Can Benefit from Yihai Kerry Arawana Holdings Co., Ltd (300999SZ)?
- Investors: Make informed decisions with a high-quality valuation tool tailored for Yihai Kerry Arawana Holdings.
- Financial Analysts: Streamline your workflow with a customizable DCF model specifically designed for this company.
- Consultants: Effortlessly modify the template for client discussions or analysis related to Yihai Kerry Arawana.
- Finance Enthusiasts: Enhance your grasp of valuation methodologies using practical examples from Yihai Kerry Arawana Holdings.
- Educators and Students: Utilize this resource as an effective learning aid in finance courses focused on public companies like Yihai Kerry Arawana.
Contents of the Template
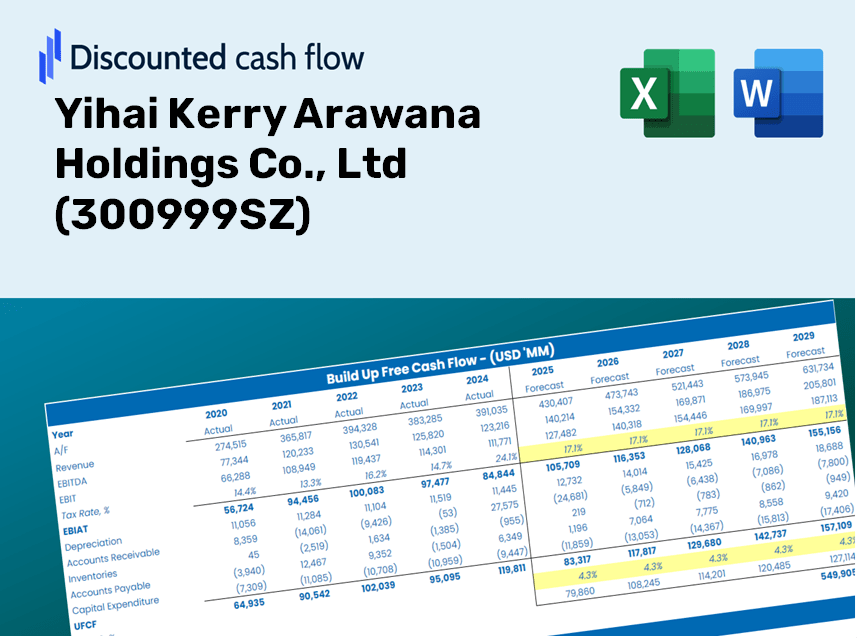
- Preloaded Yihai Kerry Arawana Data: Historical and forecasted financial metrics, including revenue, EBIT, and capital expenditures.
- DCF and WACC Models: Advanced sheets for calculating intrinsic value and Weighted Average Cost of Capital.
- Editable Inputs: Cells highlighted in yellow for modifying revenue growth assumptions, tax rates, and discount rates.
- Financial Statements: Detailed annual and quarterly financial statements for in-depth analysis.
- Key Ratios: Ratios related to profitability, leverage, and efficiency for performance evaluation.
- Dashboard and Charts: Visual representations of valuation results and underlying assumptions.
Disclaimer
All information, articles, and product details provided on this website are for general informational and educational purposes only. We do not claim any ownership over, nor do we intend to infringe upon, any trademarks, copyrights, logos, brand names, or other intellectual property mentioned or depicted on this site. Such intellectual property remains the property of its respective owners, and any references here are made solely for identification or informational purposes, without implying any affiliation, endorsement, or partnership.
We make no representations or warranties, express or implied, regarding the accuracy, completeness, or suitability of any content or products presented. Nothing on this website should be construed as legal, tax, investment, financial, medical, or other professional advice. In addition, no part of this site—including articles or product references—constitutes a solicitation, recommendation, endorsement, advertisement, or offer to buy or sell any securities, franchises, or other financial instruments, particularly in jurisdictions where such activity would be unlawful.
All content is of a general nature and may not address the specific circumstances of any individual or entity. It is not a substitute for professional advice or services. Any actions you take based on the information provided here are strictly at your own risk. You accept full responsibility for any decisions or outcomes arising from your use of this website and agree to release us from any liability in connection with your use of, or reliance upon, the content or products found herein.