
|
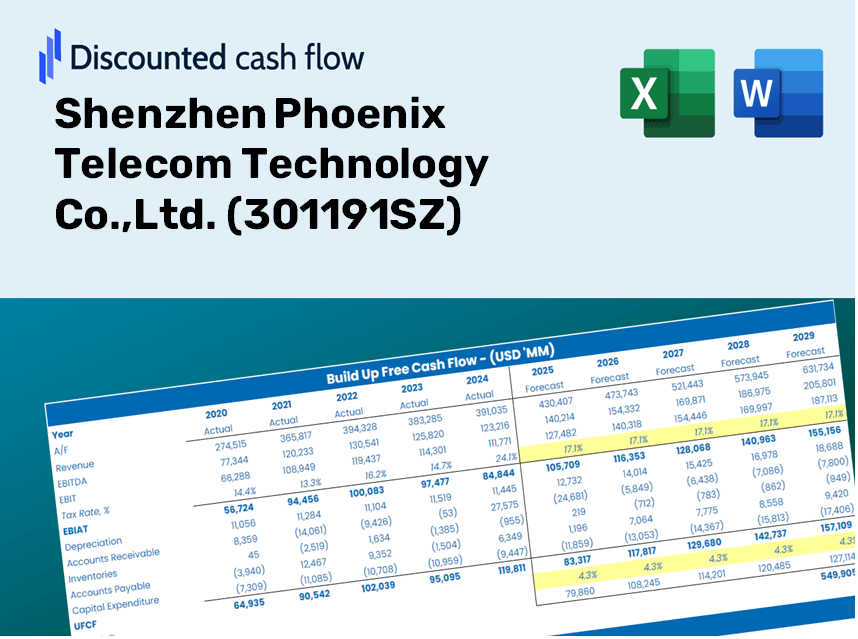
Shenzhen Phoenix Telecom Technology Co., Ltd. (301191.sz) DCF -Bewertung |
Fully Editable: Tailor To Your Needs In Excel Or Sheets
Professional Design: Trusted, Industry-Standard Templates
Investor-Approved Valuation Models
MAC/PC Compatible, Fully Unlocked
No Expertise Is Needed; Easy To Follow
Shenzhen Phoenix Telecom Technology Co.,Ltd. (301191.SZ) Bundle
Bewerten Sie die finanzielle Aussichten von Shenzhen Phoenix Telecom Technology Co., Ltd. wie ein Experte! Dieser DCF-Taschenrechner (301191SZ) bietet Ihnen vorgefüllte Finanzdaten und die Flexibilität, das Umsatzwachstum, WACC, Margen und andere wesentliche Annahmen zu ändern, um sich mit Ihren Vorhersagen auszurichten.
What You Will Receive
- Authentic 301191SZ Financial Data: Pre-loaded with Shenzhen Phoenix Telecom's historical and projected figures for accurate analysis.
- Completely Customizable Template: Easily adjust key metrics such as revenue growth, WACC, and EBITDA percentage.
- Real-Time Calculations: Instantly view updates to Shenzhen Phoenix Telecom's intrinsic value based on your modifications.
- Expert Valuation Tool: Tailored for investors, analysts, and consultants in search of precise DCF results.
- Accessible Design: Straightforward layout and clear guidance suitable for all skill levels.
Key Features
- Comprehensive Historical Data: Access Shenzhen Phoenix Telecom's past financial statements and pre-filled projections.
- Customizable Parameters: Modify WACC, tax rates, revenue growth, and EBITDA margins to fit your analysis.
- Real-Time Insights: View the intrinsic value of Shenzhen Phoenix Telecom (301191SZ) update live as you make changes.
- Intuitive Visual Representations: Dashboard graphics illustrate valuation outcomes and essential metrics.
- Designed for Precision: A robust tool tailored for analysts, investors, and finance professionals.
How It Functions
- Step 1: Download the Excel spreadsheet.
- Step 2: Review the pre-filled data for Shenzhen Phoenix Telecom Technology Co., Ltd. (301191SZ) (historical and forecasted).
- Step 3: Modify key assumptions in the highlighted cells (yellow) according to your analysis.
- Step 4: Observe automatic recalculations for the intrinsic value of Shenzhen Phoenix Telecom Technology Co., Ltd. (301191SZ).
- Step 5: Utilize the results for investment decisions or reporting purposes.
Why Choose This Calculator for Shenzhen Phoenix Telecom Technology Co., Ltd. (301191SZ)?
- Designed for Industry Experts: A sophisticated tool tailored for analysts, CFOs, and telecom consultants.
- Comprehensive Data: Historical and projected financials for Shenzhen Phoenix Telecom preloaded for precise analysis.
- Versatile Scenario Analysis: Easily explore various forecasts and assumptions with our intuitive interface.
- Insightful Outputs: Automatically computes intrinsic value, NPV, and essential metrics.
- User-Friendly: Detailed step-by-step guidance to streamline your calculations.
Who Can Benefit from This Product?
- Telecom Students: Master valuation methods and apply them using relevant industry data.
- Researchers: Integrate professional valuation models into your studies or academic projects.
- Investors: Evaluate your investment hypotheses and assess valuation results for Shenzhen Phoenix Telecom Technology Co.,Ltd. (301191SZ).
- Market Analysts: Enhance your productivity with a ready-to-use, customizable DCF model tailored for the telecom sector.
- Entrepreneurs: Understand the analytical approaches used for evaluating major telecom companies like Shenzhen Phoenix Telecom Technology Co.,Ltd. (301191SZ).
Contents of the Template
- Pre-Filled Data: Features Shenzhen Phoenix Telecom Technology Co., Ltd.'s historical financial data and projections.
- Discounted Cash Flow Model: An editable DCF valuation model that performs automatic calculations.
- Weighted Average Cost of Capital (WACC): A dedicated worksheet for calculating WACC using tailored inputs.
- Key Financial Ratios: Assess Shenzhen Phoenix's profitability, efficiency, and leverage metrics.
- Customizable Inputs: Easily modify revenue growth, profit margins, and tax rates.
- Clear Dashboard: Visuals and tables that summarize essential valuation outcomes.
Disclaimer
All information, articles, and product details provided on this website are for general informational and educational purposes only. We do not claim any ownership over, nor do we intend to infringe upon, any trademarks, copyrights, logos, brand names, or other intellectual property mentioned or depicted on this site. Such intellectual property remains the property of its respective owners, and any references here are made solely for identification or informational purposes, without implying any affiliation, endorsement, or partnership.
We make no representations or warranties, express or implied, regarding the accuracy, completeness, or suitability of any content or products presented. Nothing on this website should be construed as legal, tax, investment, financial, medical, or other professional advice. In addition, no part of this site—including articles or product references—constitutes a solicitation, recommendation, endorsement, advertisement, or offer to buy or sell any securities, franchises, or other financial instruments, particularly in jurisdictions where such activity would be unlawful.
All content is of a general nature and may not address the specific circumstances of any individual or entity. It is not a substitute for professional advice or services. Any actions you take based on the information provided here are strictly at your own risk. You accept full responsibility for any decisions or outcomes arising from your use of this website and agree to release us from any liability in connection with your use of, or reliance upon, the content or products found herein.