
|
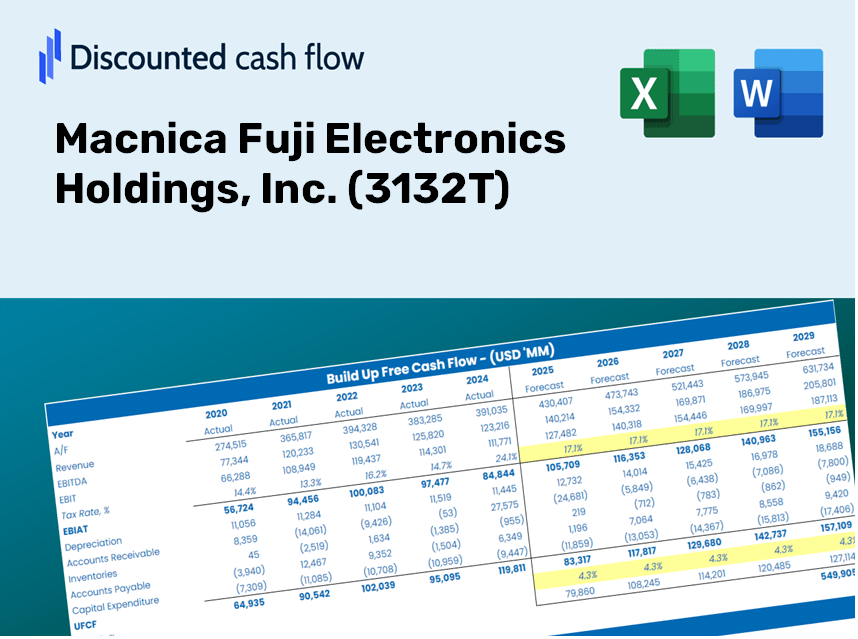
Macnica Fuji Electronics Holdings, Inc. (3132.t) DCF -Bewertung |
Fully Editable: Tailor To Your Needs In Excel Or Sheets
Professional Design: Trusted, Industry-Standard Templates
Investor-Approved Valuation Models
MAC/PC Compatible, Fully Unlocked
No Expertise Is Needed; Easy To Follow
Macnica Fuji Electronics Holdings, Inc. (3132.T) Bundle
Möchten Sie den inneren Wert von Macnica Fuji Electronics Holdings, Inc. bestimmen? Unser 3132T-DCF-Taschenrechner integriert reale Daten mit umfangreichen Anpassungsfunktionen, sodass Sie Ihre Prognosen verfeinern und Ihre Anlagestrategien verbessern können.
Discounted Cash Flow (DCF) - (USD MM)
| Year | AY1 2020 |
AY2 2021 |
AY3 2022 |
AY4 2023 |
AY5 2024 |
FY1 2025 |
FY2 2026 |
FY3 2027 |
FY4 2028 |
FY5 2029 |
|---|---|---|---|---|---|---|---|---|---|---|
| Revenue | 553,962.0 | 761,823.0 | 1,029,263.0 | 1,028,718.0 | 1,034,180.0 | 1,223,191.6 | 1,446,747.8 | 1,711,162.3 | 2,023,902.3 | 2,393,800.2 |
| Revenue Growth, % | 0 | 37.52 | 35.11 | -0.05295051 | 0.53095 | 18.28 | 18.28 | 18.28 | 18.28 | 18.28 |
| EBITDA | 18,699.0 | 40,772.0 | 64,138.0 | 71,771.0 | 43,289.0 | 63,903.0 | 75,582.2 | 89,396.0 | 105,734.4 | 125,058.9 |
| EBITDA, % | 3.38 | 5.35 | 6.23 | 6.98 | 4.19 | 5.22 | 5.22 | 5.22 | 5.22 | 5.22 |
| Depreciation | 2,118.0 | 3,355.0 | 4,089.0 | 3,620.0 | 3,897.0 | 4,767.3 | 5,638.6 | 6,669.1 | 7,888.0 | 9,329.7 |
| Depreciation, % | 0.38234 | 0.44039 | 0.39727 | 0.35189 | 0.37682 | 0.38974 | 0.38974 | 0.38974 | 0.38974 | 0.38974 |
| EBIT | 16,581.0 | 37,417.0 | 60,049.0 | 68,151.0 | 39,392.0 | 59,135.7 | 69,943.6 | 82,726.8 | 97,846.4 | 115,729.2 |
| EBIT, % | 2.99 | 4.91 | 5.83 | 6.62 | 3.81 | 4.83 | 4.83 | 4.83 | 4.83 | 4.83 |
| Total Cash | 25,443.0 | 25,174.0 | 37,571.0 | 38,710.0 | 48,530.0 | 48,935.4 | 57,879.1 | 68,457.4 | 80,969.0 | 95,767.2 |
| Total Cash, percent | .0 | .0 | .0 | .0 | .0 | .0 | .0 | .0 | .0 | .0 |
| Account Receivables | 119,362.0 | 154,893.0 | 202,696.0 | 207,031.0 | 214,724.0 | 250,656.5 | 296,467.7 | 350,651.5 | 414,738.2 | 490,537.7 |
| Account Receivables, % | 21.55 | 20.33 | 19.69 | 20.13 | 20.76 | 20.49 | 20.49 | 20.49 | 20.49 | 20.49 |
| Inventories | 84,882.0 | 138,764.0 | 218,905.0 | 234,001.0 | 234,549.0 | 245,206.2 | 290,021.2 | 343,026.9 | 405,720.1 | 479,871.4 |
| Inventories, % | 15.32 | 18.21 | 21.27 | 22.75 | 22.68 | 20.05 | 20.05 | 20.05 | 20.05 | 20.05 |
| Accounts Payable | 39,437.0 | 57,692.0 | 186,838.0 | 151,126.0 | 147,887.0 | 151,272.6 | 178,919.9 | 211,620.2 | 250,296.8 | 296,042.3 |
| Accounts Payable, % | 7.12 | 7.57 | 18.15 | 14.69 | 14.3 | 12.37 | 12.37 | 12.37 | 12.37 | 12.37 |
| Capital Expenditure | -2,388.0 | -3,556.0 | -2,148.0 | -2,270.0 | -1,657.0 | -3,638.8 | -4,303.9 | -5,090.5 | -6,020.8 | -7,121.2 |
| Capital Expenditure, % | -0.43108 | -0.46678 | -0.20869 | -0.22066 | -0.16022 | -0.29749 | -0.29749 | -0.29749 | -0.29749 | -0.29749 |
| Tax Rate, % | 32.57 | 32.57 | 32.57 | 32.57 | 32.57 | 32.57 | 32.57 | 32.57 | 32.57 | 32.57 |
| EBITAT | 11,078.1 | 26,031.8 | 42,370.6 | 49,438.6 | 26,561.8 | 41,030.3 | 48,529.2 | 57,398.6 | 67,889.0 | 80,296.8 |
| Depreciation | ||||||||||
| Changes in Account Receivables | ||||||||||
| Changes in Inventories | ||||||||||
| Changes in Accounts Payable | ||||||||||
| Capital Expenditure | ||||||||||
| UFCF | -153,998.9 | -45,327.2 | 45,513.6 | -4,354.4 | 17,321.8 | -1,045.3 | -13,115.0 | -15,512.0 | -18,347.0 | -21,700.2 |
| WACC, % | 5.45 | 5.46 | 5.47 | 5.48 | 5.45 | 5.46 | 5.46 | 5.46 | 5.46 | 5.46 |
| PV UFCF | ||||||||||
| SUM PV UFCF | -57,471.9 | |||||||||
| Long Term Growth Rate, % | 1.00 | |||||||||
| Free cash flow (T + 1) | -21,917 | |||||||||
| Terminal Value | -491,176 | |||||||||
| Present Terminal Value | -376,490 | |||||||||
| Enterprise Value | -433,962 | |||||||||
| Net Debt | 27,394 | |||||||||
| Equity Value | -461,356 | |||||||||
| Diluted Shares Outstanding, MM | 179 | |||||||||
| Equity Value Per Share | -2,571.97 |
What You Will Receive
- Genuine (3132T) Financial Data: Pre-populated with Macnica Fuji Electronics Holdings' historical and forecasted data for accurate analysis.
- Completely Customizable Template: Easily adjust essential variables such as revenue growth, WACC, and EBITDA percentage.
- Instantaneous Calculations: Observe updates to Macnica Fuji's intrinsic value in real-time as you make modifications.
- Professional Valuation Resource: Tailored for investors, analysts, and consultants aiming for precise DCF results.
- Intuitive Design: Clear layout and straightforward instructions suitable for all experience levels.
Key Features
- Authentic Macnica Fuji Financial Data: Access reliable pre-loaded historical figures and future forecasts.
- Personalized Forecast Assumptions: Modify the yellow-highlighted fields such as WACC, growth rates, and profit margins.
- Real-Time Calculations: Automatic adjustments for DCF, Net Present Value (NPV), and cash flow assessments.
- User-Friendly Dashboard: Clear charts and summaries to easily interpret your valuation outcomes.
- Designed for All Users: An easy-to-navigate structure tailored for investors, CFOs, and consultants.
How It Works
- Step 1: Download the Excel file for Macnica Fuji Electronics Holdings, Inc. (3132T).
- Step 2: Examine the pre-filled financial data and projections for Macnica Fuji.
- Step 3: Adjust key inputs, such as revenue growth, WACC, and tax rates (highlighted cells).
- Step 4: Observe the DCF model update in real-time as you alter your assumptions.
- Step 5: Evaluate the outputs to inform your investment decisions regarding Macnica Fuji Electronics Holdings, Inc. (3132T).
Why Opt for This Calculator?
- All-in-One Solution: Features DCF, WACC, and financial ratio analyses in a single tool.
- Flexible Inputs: Modify the yellow-highlighted cells to explore different scenarios.
- In-Depth Analysis: Automatically determines the intrinsic value and Net Present Value for Macnica Fuji Electronics Holdings, Inc. ([3132T]).
- Preloaded Information: Historical and projected data provide reliable starting points.
- High-Quality Standards: Perfect for financial analysts, investors, and business consultants alike.
Who Can Benefit from This Product?
- Finance Students: Master valuation techniques and apply them using actual market data for Macnica Fuji Electronics Holdings, Inc. (3132T).
- Academics: Enhance your coursework or research by integrating professional valuation models related to Macnica Fuji Electronics Holdings, Inc. (3132T).
- Investors: Validate your assumptions and conduct in-depth valuation analyses on Macnica Fuji Electronics Holdings, Inc. (3132T) stock.
- Analysts: Optimize your analysis process with a customizable DCF model that fits the needs of Macnica Fuji Electronics Holdings, Inc. (3132T).
- Small Business Owners: Discover valuable insights into the valuation practices used for prominent companies like Macnica Fuji Electronics Holdings, Inc. (3132T).
Contents of the Template
- Pre-Filled Data: Contains historical financial data and projections for Macnica Fuji Electronics Holdings, Inc. (3132T).
- Discounted Cash Flow Model: Fully editable DCF valuation model featuring automatic computations.
- Weighted Average Cost of Capital (WACC): A specific worksheet for WACC calculations based on your customized inputs.
- Key Financial Ratios: Evaluate Macnica Fuji's profitability, operational efficiency, and financial leverage.
- Customizable Inputs: Easily modify revenue growth rates, profit margins, and tax percentages.
- User-Friendly Dashboard: Visual charts and tables that summarize essential valuation findings.
Disclaimer
All information, articles, and product details provided on this website are for general informational and educational purposes only. We do not claim any ownership over, nor do we intend to infringe upon, any trademarks, copyrights, logos, brand names, or other intellectual property mentioned or depicted on this site. Such intellectual property remains the property of its respective owners, and any references here are made solely for identification or informational purposes, without implying any affiliation, endorsement, or partnership.
We make no representations or warranties, express or implied, regarding the accuracy, completeness, or suitability of any content or products presented. Nothing on this website should be construed as legal, tax, investment, financial, medical, or other professional advice. In addition, no part of this site—including articles or product references—constitutes a solicitation, recommendation, endorsement, advertisement, or offer to buy or sell any securities, franchises, or other financial instruments, particularly in jurisdictions where such activity would be unlawful.
All content is of a general nature and may not address the specific circumstances of any individual or entity. It is not a substitute for professional advice or services. Any actions you take based on the information provided here are strictly at your own risk. You accept full responsibility for any decisions or outcomes arising from your use of this website and agree to release us from any liability in connection with your use of, or reliance upon, the content or products found herein.