
|
Joyful Honda Co., Ltd. (3191.t) DCF -Bewertung |
Fully Editable: Tailor To Your Needs In Excel Or Sheets
Professional Design: Trusted, Industry-Standard Templates
Investor-Approved Valuation Models
MAC/PC Compatible, Fully Unlocked
No Expertise Is Needed; Easy To Follow
Joyful Honda Co., Ltd. (3191.T) Bundle
Vereinfachen Sie die Joyful Honda Co., Ltd. (3191t) Bewertung mit diesem anpassbaren DCF -Taschenrechner! Mit Real Joyful Honda Co., Ltd. (3191t) Finanzdaten und einstellbaren Prognoseeingängen können Sie Szenarien testen und Joyful Honda Co., Ltd. (3191t) in Minuten faire Wert aufdecken.
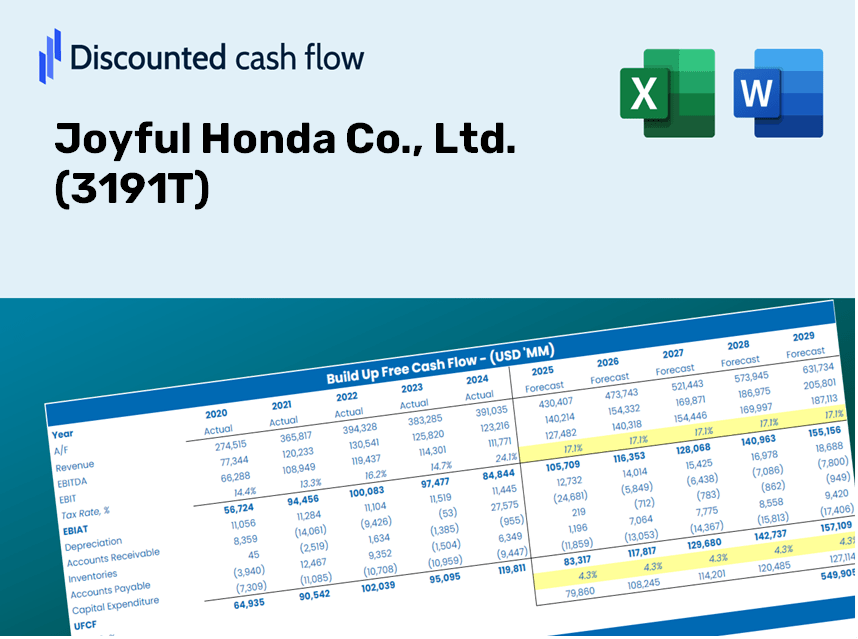
Discounted Cash Flow (DCF) - (USD MM)
| Year | AY1 2020 |
AY2 2021 |
AY3 2022 |
AY4 2023 |
AY5 2024 |
FY1 2025 |
FY2 2026 |
FY3 2027 |
FY4 2028 |
FY5 2029 |
|---|---|---|---|---|---|---|---|---|---|---|
| Revenue | 137,924.0 | 129,053.0 | 129,260.0 | 133,325.0 | 135,738.0 | 135,291.2 | 134,845.8 | 134,401.9 | 133,959.5 | 133,518.6 |
| Revenue Growth, % | 0 | -6.43 | 0.1604 | 3.14 | 1.81 | -0.32918 | -0.32918 | -0.32918 | -0.32918 | -0.32918 |
| EBITDA | 15,741.0 | 16,644.0 | 15,225.0 | 16,649.0 | 14,967.0 | 16,127.3 | 16,074.3 | 16,021.3 | 15,968.6 | 15,916.0 |
| EBITDA, % | 11.41 | 12.9 | 11.78 | 12.49 | 11.03 | 11.92 | 11.92 | 11.92 | 11.92 | 11.92 |
| Depreciation | 2,805.0 | 2,696.0 | 2,952.0 | 3,656.0 | 3,224.0 | 3,118.2 | 3,107.9 | 3,097.7 | 3,087.5 | 3,077.3 |
| Depreciation, % | 2.03 | 2.09 | 2.28 | 2.74 | 2.38 | 2.3 | 2.3 | 2.3 | 2.3 | 2.3 |
| EBIT | 12,936.0 | 13,948.0 | 12,273.0 | 12,993.0 | 11,743.0 | 13,009.2 | 12,966.4 | 12,923.7 | 12,881.1 | 12,838.7 |
| EBIT, % | 9.38 | 10.81 | 9.49 | 9.75 | 8.65 | 9.62 | 9.62 | 9.62 | 9.62 | 9.62 |
| Total Cash | 45,533.0 | 42,520.0 | 35,022.0 | 27,457.0 | 32,256.0 | 37,181.4 | 37,059.0 | 36,937.0 | 36,815.4 | 36,694.2 |
| Total Cash, percent | .0 | .0 | .0 | .0 | .0 | .0 | .0 | .0 | .0 | .0 |
| Account Receivables | 3,266.0 | 3,392.0 | 4,063.0 | 4,449.0 | 4,652.0 | 4,032.7 | 4,019.4 | 4,006.2 | 3,993.0 | 3,979.9 |
| Account Receivables, % | 2.37 | 2.63 | 3.14 | 3.34 | 3.43 | 2.98 | 2.98 | 2.98 | 2.98 | 2.98 |
| Inventories | 14,350.0 | 16,231.0 | 18,728.0 | 19,276.0 | 20,509.0 | 18,139.0 | 18,079.3 | 18,019.8 | 17,960.5 | 17,901.4 |
| Inventories, % | 10.4 | 12.58 | 14.49 | 14.46 | 15.11 | 13.41 | 13.41 | 13.41 | 13.41 | 13.41 |
| Accounts Payable | 6,925.0 | 6,443.0 | 6,511.0 | 7,235.0 | 7,114.0 | 6,958.9 | 6,936.0 | 6,913.1 | 6,890.4 | 6,867.7 |
| Accounts Payable, % | 5.02 | 4.99 | 5.04 | 5.43 | 5.24 | 5.14 | 5.14 | 5.14 | 5.14 | 5.14 |
| Capital Expenditure | -2,264.0 | -5,957.0 | -8,902.0 | -9,013.0 | -1,939.0 | -5,772.3 | -5,753.3 | -5,734.4 | -5,715.5 | -5,696.7 |
| Capital Expenditure, % | -1.64 | -4.62 | -6.89 | -6.76 | -1.43 | -4.27 | -4.27 | -4.27 | -4.27 | -4.27 |
| Tax Rate, % | 28.8 | 28.8 | 28.8 | 28.8 | 28.8 | 28.8 | 28.8 | 28.8 | 28.8 | 28.8 |
| EBITAT | 9,011.5 | 11,123.5 | 8,544.0 | 9,101.5 | 8,361.2 | 9,373.9 | 9,343.0 | 9,312.3 | 9,281.6 | 9,251.0 |
| Depreciation | ||||||||||
| Changes in Account Receivables | ||||||||||
| Changes in Inventories | ||||||||||
| Changes in Accounts Payable | ||||||||||
| Capital Expenditure | ||||||||||
| UFCF | -1,138.5 | 5,373.5 | -506.0 | 3,534.5 | 8,089.2 | 9,553.8 | 6,747.7 | 6,725.4 | 6,703.3 | 6,681.2 |
| WACC, % | 4.44 | 4.48 | 4.44 | 4.44 | 4.44 | 4.45 | 4.45 | 4.45 | 4.45 | 4.45 |
| PV UFCF | ||||||||||
| SUM PV UFCF | 32,243.1 | |||||||||
| Long Term Growth Rate, % | 0.50 | |||||||||
| Free cash flow (T + 1) | 6,715 | |||||||||
| Terminal Value | 170,156 | |||||||||
| Present Terminal Value | 136,894 | |||||||||
| Enterprise Value | 169,137 | |||||||||
| Net Debt | -17,525 | |||||||||
| Equity Value | 186,662 | |||||||||
| Diluted Shares Outstanding, MM | 62 | |||||||||
| Equity Value Per Share | 3,030.23 |
Benefits You Will Receive
- Genuine 3191T Financial Data: Access to both historical and projected figures for precise valuation.
- Customizable Inputs: Adjust metrics like WACC, tax rates, revenue growth, and capital investment.
- Real-Time Calculations: Intrinsic value and NPV are computed automatically.
- Scenario Modeling: Evaluate various scenarios to assess the future potential of Joyful Honda Co., Ltd.
- User-Friendly Interface: Designed for professionals while remaining easy to use for newcomers.
Key Features
- 🔍 Real-Life Joyful Honda Financials: Pre-filled historical and projected data for Joyful Honda Co., Ltd. (3191T).
- ✏️ Fully Customizable Inputs: Adjust all critical parameters (yellow cells) such as WACC, growth %, and tax rates.
- 📊 Professional DCF Valuation: Built-in formulas compute Joyful Honda’s intrinsic value using the Discounted Cash Flow method.
- ⚡ Instant Results: Visualize Joyful Honda’s valuation immediately after making adjustments.
- Scenario Analysis: Evaluate and compare results for different financial assumptions side-by-side.
How It Works
- Step 1: Download the prebuilt Excel template featuring Joyful Honda Co., Ltd.'s data.
- Step 2: Dive into the pre-filled sheets to familiarize yourself with the essential metrics.
- Step 3: Modify the forecasts and assumptions in the editable yellow cells (WACC, growth, margins).
- Step 4: Instantly see the recalculated results, including Joyful Honda's intrinsic value.
- Step 5: Use the outputs to make informed investment choices or create detailed reports.
Why Opt for the Joyful Honda Calculator?
- Designed for Industry Experts: A sophisticated tool utilized by analysts, CFOs, and financial consultants.
- Accurate Data: Joyful Honda’s historical and projected financial information is preloaded for precision.
- Flexibility in Analysis: Effortlessly test various scenarios and assumptions.
- Clear Results: Automatically determines intrinsic value, NPV, and other critical metrics.
- User-Friendly: Detailed step-by-step instructions to assist you throughout the process.
Who Should Consider This Product?
- Individual Investors: Make informed choices regarding the purchase or sale of Joyful Honda Co., Ltd. (3191T) stock.
- Financial Analysts: Enhance your valuation processes with accessible financial models tailored for Joyful Honda Co., Ltd. (3191T).
- Consultants: Provide clients with accurate and timely valuation insights on Joyful Honda Co., Ltd. (3191T).
- Business Owners: Gain an understanding of how major companies like Joyful Honda Co., Ltd. (3191T) are valued to inform your own business strategy.
- Finance Students: Acquire hands-on experience with valuation techniques using data and scenarios from Joyful Honda Co., Ltd. (3191T).
What the Template Includes
- Historical Data: Contains Joyful Honda Co., Ltd.'s (3191T) previous financial metrics and baseline forecasts.
- DCF and Levered DCF Models: Comprehensive templates designed to assess Joyful Honda’s (3191T) intrinsic value.
- WACC Sheet: Pre-configured calculations for the Weighted Average Cost of Capital.
- Editable Inputs: Customize essential drivers such as growth rates, EBITDA percentages, and CAPEX assumptions.
- Quarterly and Annual Statements: A thorough analysis of Joyful Honda’s (3191T) financial performance.
- Interactive Dashboard: Visualize valuation outcomes and forecasts in a dynamic format.
Disclaimer
All information, articles, and product details provided on this website are for general informational and educational purposes only. We do not claim any ownership over, nor do we intend to infringe upon, any trademarks, copyrights, logos, brand names, or other intellectual property mentioned or depicted on this site. Such intellectual property remains the property of its respective owners, and any references here are made solely for identification or informational purposes, without implying any affiliation, endorsement, or partnership.
We make no representations or warranties, express or implied, regarding the accuracy, completeness, or suitability of any content or products presented. Nothing on this website should be construed as legal, tax, investment, financial, medical, or other professional advice. In addition, no part of this site—including articles or product references—constitutes a solicitation, recommendation, endorsement, advertisement, or offer to buy or sell any securities, franchises, or other financial instruments, particularly in jurisdictions where such activity would be unlawful.
All content is of a general nature and may not address the specific circumstances of any individual or entity. It is not a substitute for professional advice or services. Any actions you take based on the information provided here are strictly at your own risk. You accept full responsibility for any decisions or outcomes arising from your use of this website and agree to release us from any liability in connection with your use of, or reliance upon, the content or products found herein.