
|
Nomura Real Estate Holdings, Inc. (3231.T) DCF -Bewertung |
Fully Editable: Tailor To Your Needs In Excel Or Sheets
Professional Design: Trusted, Industry-Standard Templates
Investor-Approved Valuation Models
MAC/PC Compatible, Fully Unlocked
No Expertise Is Needed; Easy To Follow
Nomura Real Estate Holdings, Inc. (3231.T) Bundle
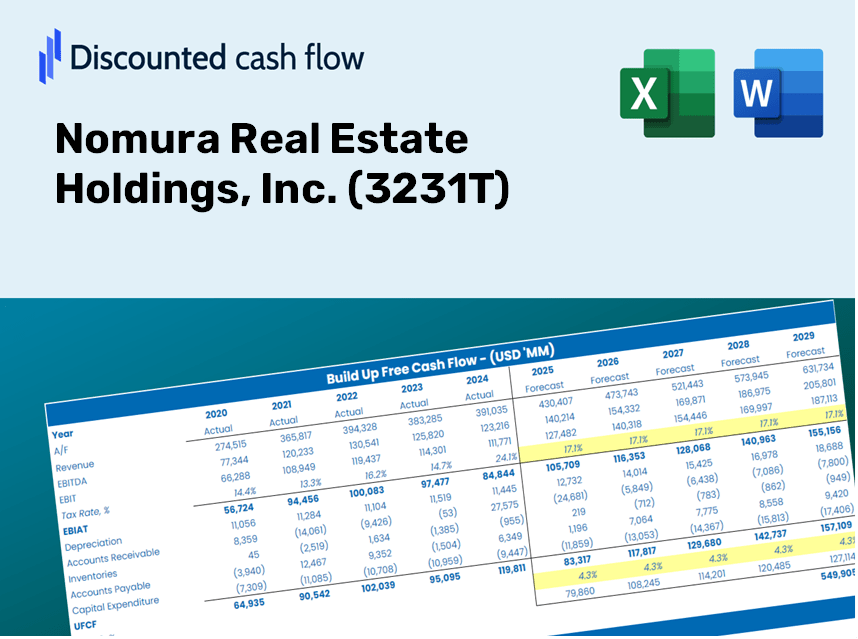
Unabhängig davon, ob Sie ein Anleger oder Analyst sind, ist dieser (3231T) DCF-Taschenrechner Ihre Anlaufstelle für eine genaue Bewertung. Mit echten Daten von Nomura Real Estate Holdings, Inc. geladen, können Sie Prognosen anpassen und die Auswirkungen in Echtzeit beobachten.
Discounted Cash Flow (DCF) - (USD MM)
| Year | AY1 2021 |
AY2 2022 |
AY3 2023 |
AY4 2024 |
AY5 2025 |
FY1 2026 |
FY2 2027 |
FY3 2028 |
FY4 2029 |
FY5 2030 |
|---|---|---|---|---|---|---|---|---|---|---|
| Revenue | 580,660.0 | 645,049.0 | 654,735.0 | 734,715.0 | 757,638.0 | 782,895.4 | 808,994.7 | 835,964.2 | 863,832.7 | 892,630.2 |
| Revenue Growth, % | 0 | 11.09 | 1.5 | 12.22 | 3.12 | 3.33 | 3.33 | 3.33 | 3.33 | 3.33 |
| EBITDA | 96,355.0 | 110,300.0 | 120,191.0 | 132,561.0 | 139,846.0 | 138,652.9 | 143,275.2 | 148,051.6 | 152,987.2 | 158,087.3 |
| EBITDA, % | 16.59 | 17.1 | 18.36 | 18.04 | 18.46 | 17.71 | 17.71 | 17.71 | 17.71 | 17.71 |
| Depreciation | 20,021.0 | 19,089.0 | 20,593.0 | 20,445.0 | 20,888.0 | 23,631.3 | 24,419.1 | 25,233.1 | 26,074.3 | 26,943.6 |
| Depreciation, % | 3.45 | 2.96 | 3.15 | 2.78 | 2.76 | 3.02 | 3.02 | 3.02 | 3.02 | 3.02 |
| EBIT | 76,334.0 | 91,211.0 | 99,598.0 | 112,116.0 | 118,958.0 | 115,021.7 | 118,856.1 | 122,818.4 | 126,912.8 | 131,143.7 |
| EBIT, % | 13.15 | 14.14 | 15.21 | 15.26 | 15.7 | 14.69 | 14.69 | 14.69 | 14.69 | 14.69 |
| Total Cash | 100,395.0 | 102,909.0 | 61,383.0 | 102,956.0 | 140,325.0 | 117,674.1 | 121,597.0 | 125,650.7 | 129,839.5 | 134,168.0 |
| Total Cash, percent | .0 | .0 | .0 | .0 | .0 | .0 | .0 | .0 | .0 | .0 |
| Account Receivables | 19,621.0 | 22,005.0 | 40,876.0 | 27,524.0 | 32,410.0 | 32,971.8 | 34,070.9 | 35,206.8 | 36,380.4 | 37,593.3 |
| Account Receivables, % | 3.38 | 3.41 | 6.24 | 3.75 | 4.28 | 4.21 | 4.21 | 4.21 | 4.21 | 4.21 |
| Inventories | 875,200.0 | 893,781.0 | 998,292.0 | 1,011,139.0 | .0 | 626,316.3 | 647,195.8 | 668,771.3 | 691,066.1 | 714,104.2 |
| Inventories, % | 150.73 | 138.56 | 152.47 | 137.62 | 0 | 80 | 80 | 80 | 80 | 80 |
| Accounts Payable | 61,162.0 | 80,992.0 | 65,805.0 | 78,651.0 | 94,382.0 | 88,157.4 | 91,096.3 | 94,133.1 | 97,271.2 | 100,514.0 |
| Accounts Payable, % | 10.53 | 12.56 | 10.05 | 10.7 | 12.46 | 11.26 | 11.26 | 11.26 | 11.26 | 11.26 |
| Capital Expenditure | -45,665.0 | -36,618.0 | -44,064.0 | -66,013.0 | -167,343.0 | -80,393.1 | -83,073.2 | -85,842.6 | -88,704.3 | -91,661.5 |
| Capital Expenditure, % | -7.86 | -5.68 | -6.73 | -8.98 | -22.09 | -10.27 | -10.27 | -10.27 | -10.27 | -10.27 |
| Tax Rate, % | 28.24 | 28.24 | 28.24 | 28.24 | 28.24 | 28.24 | 28.24 | 28.24 | 28.24 | 28.24 |
| EBITAT | 51,275.7 | 62,244.8 | 72,950.5 | 79,069.2 | 85,361.1 | 80,731.9 | 83,423.3 | 86,204.4 | 89,078.1 | 92,047.7 |
| Depreciation | ||||||||||
| Changes in Account Receivables | ||||||||||
| Changes in Inventories | ||||||||||
| Changes in Accounts Payable | ||||||||||
| Capital Expenditure | ||||||||||
| UFCF | -808,027.3 | 43,580.8 | -89,089.5 | 46,852.2 | 960,890.1 | -609,132.6 | 5,729.4 | 5,920.4 | 6,117.8 | 6,321.7 |
| WACC, % | 4.29 | 4.31 | 4.44 | 4.37 | 4.4 | 4.36 | 4.36 | 4.36 | 4.36 | 4.36 |
| PV UFCF | ||||||||||
| SUM PV UFCF | -562,948.7 | |||||||||
| Long Term Growth Rate, % | 2.00 | |||||||||
| Free cash flow (T + 1) | 6,448 | |||||||||
| Terminal Value | 273,202 | |||||||||
| Present Terminal Value | 220,704 | |||||||||
| Enterprise Value | -342,245 | |||||||||
| Net Debt | 1,508,039 | |||||||||
| Equity Value | -1,850,284 | |||||||||
| Diluted Shares Outstanding, MM | 863 | |||||||||
| Equity Value Per Share | -2,144.49 |
What You Will Receive
- Customizable Excel Template: A fully adaptable Excel-based DCF Calculator featuring pre-filled financial data for Nomura Real Estate Holdings, Inc. (3231T).
- Accurate Data: Access to historical figures and forward-looking projections (highlighted in the designated yellow cells).
- Flexible Forecasting: Adjust forecast parameters such as revenue growth rates, EBITDA margins, and WACC.
- Instant Calculations: Quickly visualize how your inputs influence the valuation of Nomura Real Estate Holdings, Inc. (3231T).
- Professional Tool: Designed for investors, CFOs, consultants, and financial analysts.
- User-Centric Design: Organized for clarity and ease of navigation, complete with step-by-step guidance.
Key Features
- Real-Time 3231T Data: Pre-loaded with Nomura Real Estate Holdings' historical financial data and future projections.
- Comprehensive Customization Options: Modify revenue growth rates, margins, WACC, tax rates, and capital expenditures to fit your analysis.
- Interactive Valuation Model: Instant updates to Net Present Value (NPV) and intrinsic value based on user-defined parameters.
- Scenario Analysis: Develop various forecast scenarios to explore different valuation possibilities.
- Intuitive Design: User-friendly layout, tailored for both experts and newcomers in the field.
How It Works
- Step 1: Download the Excel file.
- Step 2: Examine the pre-filled data for Nomura Real Estate Holdings, Inc. (3231T) (historical and projected).
- Step 3: Modify the key assumptions (yellow cells) according to your analysis.
- Step 4: Check the automatic recalculations for Nomura Real Estate Holdings, Inc. (3231T)'s intrinsic value.
- Step 5: Utilize the outputs for making investment decisions or preparing reports.
Why Choose This Calculator for Nomura Real Estate Holdings, Inc. (3231T)?
- Reliable Data: Access authentic financials of Nomura Real Estate for dependable valuation outcomes.
- Flexible Options: Tailor essential variables such as growth rates, WACC, and tax rates to align with your forecasts.
- Efficiency: Ready-to-use calculations save you the effort of starting from square one.
- Expert-Level Instrument: Created specifically for investors, analysts, and consultants.
- Easy to Use: A user-friendly design and clear, step-by-step guidance make it accessible to all users.
Who Can Benefit from This Product?
- Real Estate Students: Explore valuation strategies and apply them to real-world scenarios.
- Researchers: Integrate advanced models into your academic studies or publications.
- Investors: Validate your investment hypotheses and assess valuation results for Nomura Real Estate Holdings, Inc. (3231T).
- Analysts: Enhance your productivity with a ready-to-use, customizable DCF model.
- Property Owners: Understand the analytical approaches used for large public real estate companies like Nomura Real Estate Holdings, Inc. (3231T).
Contents of the Template
- Operating and Balance Sheet Data: Pre-filled historical data and forecasts for Nomura Real Estate Holdings, Inc. (3231T), covering revenue, EBITDA, EBIT, and capital expenditures.
- WACC Calculation: A dedicated sheet for calculating the Weighted Average Cost of Capital (WACC), incorporating parameters such as Beta, risk-free rate, and share price.
- DCF Valuation (Unlevered and Levered): Customizable Discounted Cash Flow models that provide intrinsic value assessments with thorough calculations.
- Financial Statements: Pre-loaded financial statements (both annual and quarterly) to facilitate in-depth analysis.
- Key Ratios: A collection of profitability, leverage, and efficiency ratios related to Nomura Real Estate Holdings, Inc. (3231T).
- Dashboard and Charts: A visual summary of valuation results and underlying assumptions for easier interpretation of findings.
Disclaimer
All information, articles, and product details provided on this website are for general informational and educational purposes only. We do not claim any ownership over, nor do we intend to infringe upon, any trademarks, copyrights, logos, brand names, or other intellectual property mentioned or depicted on this site. Such intellectual property remains the property of its respective owners, and any references here are made solely for identification or informational purposes, without implying any affiliation, endorsement, or partnership.
We make no representations or warranties, express or implied, regarding the accuracy, completeness, or suitability of any content or products presented. Nothing on this website should be construed as legal, tax, investment, financial, medical, or other professional advice. In addition, no part of this site—including articles or product references—constitutes a solicitation, recommendation, endorsement, advertisement, or offer to buy or sell any securities, franchises, or other financial instruments, particularly in jurisdictions where such activity would be unlawful.
All content is of a general nature and may not address the specific circumstances of any individual or entity. It is not a substitute for professional advice or services. Any actions you take based on the information provided here are strictly at your own risk. You accept full responsibility for any decisions or outcomes arising from your use of this website and agree to release us from any liability in connection with your use of, or reliance upon, the content or products found herein.