
|
Activia Properties Inc. (3279.t) DCF -Bewertung |
Fully Editable: Tailor To Your Needs In Excel Or Sheets
Professional Design: Trusted, Industry-Standard Templates
Investor-Approved Valuation Models
MAC/PC Compatible, Fully Unlocked
No Expertise Is Needed; Easy To Follow
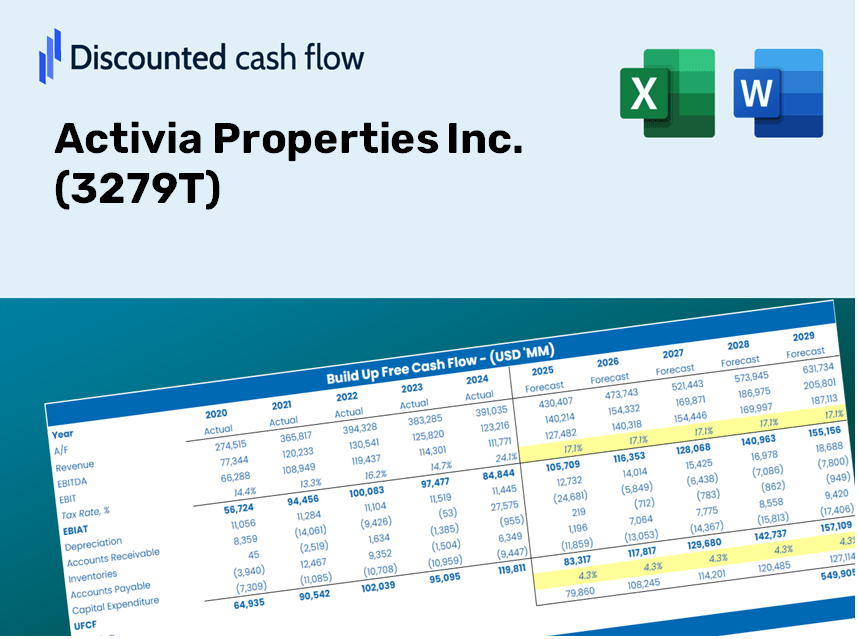
Activia Properties Inc. (3279.T) Bundle
Unser (3279t) DCF-Taschenrechner wurde zur Genauigkeit entwickelt und ermöglicht die Bewertung von Activia Properties Inc., die die Bewertung von Finanzdaten in realer Welt bewertet, und bietet vollständige Flexibilität, um alle Schlüsselparameter für erweiterte Projektionen zu ändern.
Discounted Cash Flow (DCF) - (USD MM)
| Year | AY1 2020 |
AY2 2021 |
AY3 2022 |
AY4 2023 |
AY5 2024 |
FY1 2025 |
FY2 2026 |
FY3 2027 |
FY4 2028 |
FY5 2029 |
|---|---|---|---|---|---|---|---|---|---|---|
| Revenue | 30,057.9 | 30,362.0 | 31,690.9 | 34,826.9 | 31,618.9 | 32,099.0 | 32,586.3 | 33,081.0 | 33,583.3 | 34,093.1 |
| Revenue Growth, % | 0 | 1.01 | 4.38 | 9.9 | -9.21 | 1.52 | 1.52 | 1.52 | 1.52 | 1.52 |
| EBITDA | 19,113.7 | 19,600.0 | 20,291.7 | 21,910.1 | 18,857.2 | 20,204.7 | 20,511.4 | 20,822.8 | 21,139.0 | 21,459.9 |
| EBITDA, % | 63.59 | 64.55 | 64.03 | 62.91 | 59.64 | 62.94 | 62.94 | 62.94 | 62.94 | 62.94 |
| Depreciation | 2,670.5 | 2,727.4 | 2,744.7 | 2,941.4 | 3,088.4 | 2,872.3 | 2,915.9 | 2,960.2 | 3,005.1 | 3,050.8 |
| Depreciation, % | 8.88 | 8.98 | 8.66 | 8.45 | 9.77 | 8.95 | 8.95 | 8.95 | 8.95 | 8.95 |
| EBIT | 16,443.3 | 16,872.6 | 17,547.0 | 18,968.7 | 15,768.8 | 17,332.3 | 17,595.5 | 17,862.6 | 18,133.8 | 18,409.1 |
| EBIT, % | 54.71 | 55.57 | 55.37 | 54.47 | 49.87 | 54 | 54 | 54 | 54 | 54 |
| Total Cash | 14,125.0 | 15,986.1 | 18,682.4 | 21,367.8 | 16,841.6 | 17,539.8 | 17,806.1 | 18,076.5 | 18,350.9 | 18,629.5 |
| Total Cash, percent | .0 | .0 | .0 | .0 | .0 | .0 | .0 | .0 | .0 | .0 |
| Account Receivables | 645.9 | 911.5 | 975.1 | 889.3 | 791.5 | 852.9 | 865.8 | 879.0 | 892.3 | 905.9 |
| Account Receivables, % | 2.15 | 3 | 3.08 | 2.55 | 2.5 | 2.66 | 2.66 | 2.66 | 2.66 | 2.66 |
| Inventories | 3,775.1 | 4,459.8 | 3,903.2 | .0 | .0 | 2,540.0 | 2,578.5 | 2,617.7 | 2,657.4 | 2,697.8 |
| Inventories, % | 12.56 | 14.69 | 12.32 | 0 | 0 | 7.91 | 7.91 | 7.91 | 7.91 | 7.91 |
| Accounts Payable | 1,033.3 | 928.8 | 1,828.4 | 2,348.2 | 1,899.7 | 1,606.0 | 1,630.4 | 1,655.2 | 1,680.3 | 1,705.8 |
| Accounts Payable, % | 3.44 | 3.06 | 5.77 | 6.74 | 6.01 | 5 | 5 | 5 | 5 | 5 |
| Capital Expenditure | -32,674.8 | -52,226.9 | -1,020.3 | -47,874.1 | -3,217.8 | -20,119.4 | -20,424.8 | -20,734.9 | -21,049.7 | -21,369.3 |
| Capital Expenditure, % | -108.71 | -172.01 | -3.22 | -137.46 | -10.18 | -62.68 | -62.68 | -62.68 | -62.68 | -62.68 |
| Tax Rate, % | 0.01049848 | 0.01049848 | 0.01049848 | 0.01049848 | 0.01049848 | 0.01049848 | 0.01049848 | 0.01049848 | 0.01049848 | 0.01049848 |
| EBITAT | 16,441.3 | 16,839.9 | 17,372.7 | 18,950.8 | 15,767.1 | 17,287.1 | 17,549.6 | 17,816.1 | 18,086.5 | 18,361.1 |
| Depreciation | ||||||||||
| Changes in Account Receivables | ||||||||||
| Changes in Inventories | ||||||||||
| Changes in Accounts Payable | ||||||||||
| Capital Expenditure | ||||||||||
| UFCF | -16,950.7 | -33,714.5 | 20,489.9 | -21,473.2 | 15,287.1 | -2,854.9 | 13.6 | 13.8 | 14.0 | 14.2 |
| WACC, % | 4.03 | 4.02 | 4 | 4.02 | 4.03 | 4.02 | 4.02 | 4.02 | 4.02 | 4.02 |
| PV UFCF | ||||||||||
| SUM PV UFCF | -2,696.2 | |||||||||
| Long Term Growth Rate, % | 3.00 | |||||||||
| Free cash flow (T + 1) | 15 | |||||||||
| Terminal Value | 1,435 | |||||||||
| Present Terminal Value | 1,178 | |||||||||
| Enterprise Value | -1,518 | |||||||||
| Net Debt | 248,008 | |||||||||
| Equity Value | -249,526 | |||||||||
| Diluted Shares Outstanding, MM | 1 | |||||||||
| Equity Value Per Share | -313,605.49 |
What You Will Receive
- Authentic AAPL Financials: Gather historical and forecasted data for precise valuation.
- Customizable Inputs: Adjust WACC, tax rates, revenue forecasts, and capital expenditures to suit your needs.
- Automatic Analysis: Intrinsic value and NPV calculations updated in real-time.
- Scenario Testing: Explore various scenarios to assess the potential performance of Activia Properties Inc. (3279T).
- User-Friendly Design: Crafted for industry experts while remaining approachable for newcomers.
Key Features
- Customizable Investment Metrics: Adjust essential parameters such as rental income growth, operating margins, and maintenance costs.
- Instant DCF Estimation: Generates intrinsic value, NPV, and other financial outputs in real time.
- High-Precision Valuation: Leverages Activia Properties Inc.'s actual market data for credible valuation results.
- Effortless Scenario Planning: Easily explore various assumptions and evaluate their impacts side by side.
- Efficiency Booster: Streamline your process by avoiding the complexities of developing intricate valuation models from the ground up.
How It Operates
- Download the Template: Gain immediate access to the Excel-based Activia Properties Inc. DCF Calculator.
- Input Your Assumptions: Modify the yellow-highlighted cells to set your growth rates, WACC, margins, and other factors.
- Instant Calculations: The model will automatically refresh to reflect Activia Properties Inc.'s intrinsic value.
- Test Scenarios: Experiment with various assumptions to explore potential changes in valuation.
- Analyze and Decide: Leverage the results to inform your investment or financial strategies.
Why Choose This Calculator for Activia Properties Inc. (3279T)?
- Designed for Experts: A sophisticated tool tailored for real estate analysts, investors, and property consultants.
- Comprehensive Data: Activia’s historical and projected market data preloaded for precise calculations.
- Scenario Analysis: Effortlessly test various property forecasts and assumptions.
- Intuitive Outputs: Automatically computes property valuation, cash flow, and essential metrics.
- User-Friendly: Clear, step-by-step guidance simplifies the evaluation process.
Who Should Benefit from Activia Properties Inc. (3279T)?
- Real Estate Investors: Develop comprehensive and trustworthy valuation models for property analysis.
- Corporate Finance Teams: Evaluate property valuation scenarios to inform strategic decisions.
- Consultants and Advisors: Equip clients with precise valuation insights for Activia Properties Inc. (3279T).
- Students and Educators: Utilize real-world data to enhance financial modeling skills and educational activities.
- Real Estate Enthusiasts: Gain insights into how companies like Activia Properties Inc. (3279T) are valued in the real estate market.
Contents of the Template
- Historical Data: Comprehensive overview of Activia Properties Inc.’s past financial performance and foundational forecasts.
- DCF and Levered DCF Models: In-depth templates for determining Activia Properties Inc.'s intrinsic value.
- WACC Sheet: Pre-configured calculations for the Weighted Average Cost of Capital.
- Editable Inputs: Adjust essential parameters such as growth rates, EBITDA percentages, and CAPEX estimates.
- Quarterly and Annual Statements: A thorough analysis of Activia Properties Inc.'s financial documents.
- Interactive Dashboard: Dynamically visualize valuation outcomes and forecasts.
Disclaimer
All information, articles, and product details provided on this website are for general informational and educational purposes only. We do not claim any ownership over, nor do we intend to infringe upon, any trademarks, copyrights, logos, brand names, or other intellectual property mentioned or depicted on this site. Such intellectual property remains the property of its respective owners, and any references here are made solely for identification or informational purposes, without implying any affiliation, endorsement, or partnership.
We make no representations or warranties, express or implied, regarding the accuracy, completeness, or suitability of any content or products presented. Nothing on this website should be construed as legal, tax, investment, financial, medical, or other professional advice. In addition, no part of this site—including articles or product references—constitutes a solicitation, recommendation, endorsement, advertisement, or offer to buy or sell any securities, franchises, or other financial instruments, particularly in jurisdictions where such activity would be unlawful.
All content is of a general nature and may not address the specific circumstances of any individual or entity. It is not a substitute for professional advice or services. Any actions you take based on the information provided here are strictly at your own risk. You accept full responsibility for any decisions or outcomes arising from your use of this website and agree to release us from any liability in connection with your use of, or reliance upon, the content or products found herein.