
|
Comforia Residential REIT, Inc (3282.t) DCF -Bewertung |
Fully Editable: Tailor To Your Needs In Excel Or Sheets
Professional Design: Trusted, Industry-Standard Templates
Investor-Approved Valuation Models
MAC/PC Compatible, Fully Unlocked
No Expertise Is Needed; Easy To Follow
Comforia Residential REIT, Inc (3282.T) Bundle
Gewinnen Sie einen Einblick in Ihre Comforia Residential REIT, Inc (3282T) Bewertungsanalyse mit unserem ausgefeilten DCF -Taschenrechner! Diese Excel -Vorlage wird mit realen (3282T) Daten vorinstalliert, sodass Sie Prognosen und Annahmen anpassen können, um den inneren Wert von Comforia Residential REIT, Inc.
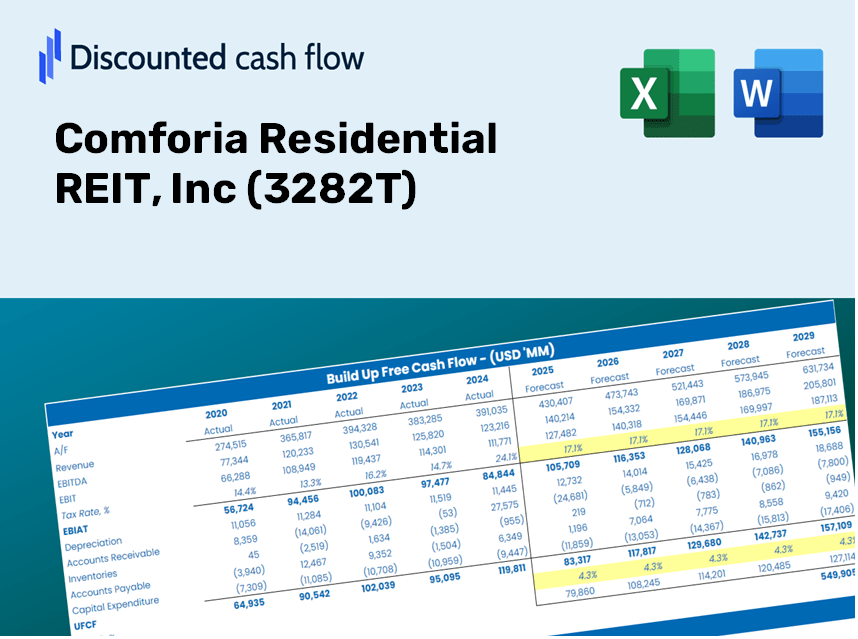
Discounted Cash Flow (DCF) - (USD MM)
| Year | AY1 2019 |
AY2 2020 |
AY3 2021 |
AY4 2022 |
AY5 2023 |
FY1 2024 |
FY2 2025 |
FY3 2026 |
FY4 2027 |
FY5 2028 |
|---|---|---|---|---|---|---|---|---|---|---|
| Revenue | 17,819.1 | 20,336.6 | 19,218.8 | 20,874.5 | 22,053.1 | 24,231.6 | 26,625.4 | 29,255.6 | 32,145.6 | 35,321.2 |
| Revenue Growth, % | 0 | 14.13 | -5.5 | 8.61 | 5.65 | 9.88 | 9.88 | 9.88 | 9.88 | 9.88 |
| EBITDA | 10,496.7 | 12,488.0 | 11,090.6 | 12,115.7 | 12,999.9 | 14,297.1 | 15,709.5 | 17,261.3 | 18,966.5 | 20,840.1 |
| EBITDA, % | 58.91 | 61.41 | 57.71 | 58.04 | 58.95 | 59 | 59 | 59 | 59 | 59 |
| Depreciation | 2,643.8 | 2,776.6 | 2,854.4 | 3,019.4 | 3,162.2 | 3,496.4 | 3,841.8 | 4,221.3 | 4,638.3 | 5,096.5 |
| Depreciation, % | 14.84 | 13.65 | 14.85 | 14.46 | 14.34 | 14.43 | 14.43 | 14.43 | 14.43 | 14.43 |
| EBIT | 7,852.9 | 9,711.4 | 8,236.2 | 9,096.3 | 9,837.7 | 10,800.7 | 11,867.7 | 13,040.0 | 14,328.2 | 15,743.6 |
| EBIT, % | 44.07 | 47.75 | 42.85 | 43.58 | 44.61 | 44.57 | 44.57 | 44.57 | 44.57 | 44.57 |
| Total Cash | 12,443.0 | 11,890.3 | 10,201.9 | 9,181.4 | 8,426.0 | 12,773.5 | 14,035.4 | 15,421.9 | 16,945.3 | 18,619.3 |
| Total Cash, percent | .0 | .0 | .0 | .0 | .0 | .0 | .0 | .0 | .0 | .0 |
| Account Receivables | 9.1 | 8.8 | 7.3 | 6.7 | 9.4 | 10.0 | 11.0 | 12.1 | 13.3 | 14.6 |
| Account Receivables, % | 0.05122597 | 0.04306028 | 0.03822813 | 0.03217799 | 0.04247926 | 0.04143433 | 0.04143433 | 0.04143433 | 0.04143433 | 0.04143433 |
| Inventories | 8,800.1 | 8,773.6 | 9,260.8 | 9,621.5 | .0 | 9,053.2 | 9,947.6 | 10,930.2 | 12,010.0 | 13,196.4 |
| Inventories, % | 49.39 | 43.14 | 48.19 | 46.09 | 0 | 37.36 | 37.36 | 37.36 | 37.36 | 37.36 |
| Accounts Payable | 812.4 | 524.2 | 632.5 | 801.0 | 1,023.6 | 916.3 | 1,006.8 | 1,106.2 | 1,215.5 | 1,335.6 |
| Accounts Payable, % | 4.56 | 2.58 | 3.29 | 3.84 | 4.64 | 3.78 | 3.78 | 3.78 | 3.78 | 3.78 |
| Capital Expenditure | -23,473.2 | -21,141.5 | -21,414.6 | -22,467.2 | -19,445.1 | -23,658.5 | -25,995.6 | -28,563.6 | -31,385.3 | -34,485.7 |
| Capital Expenditure, % | -131.73 | -103.96 | -111.42 | -107.63 | -88.17 | -97.63 | -97.63 | -97.63 | -97.63 | -97.63 |
| Tax Rate, % | 0.20437 | 0.20437 | 0.20437 | 0.20437 | 0.20437 | 0.20437 | 0.20437 | 0.20437 | 0.20437 | 0.20437 |
| EBITAT | 7,840.4 | 9,656.1 | 8,155.3 | 9,076.3 | 9,817.6 | 10,754.6 | 11,817.0 | 12,984.3 | 14,267.0 | 15,676.3 |
| Depreciation | ||||||||||
| Changes in Account Receivables | ||||||||||
| Changes in Inventories | ||||||||||
| Changes in Accounts Payable | ||||||||||
| Capital Expenditure | ||||||||||
| UFCF | -20,985.9 | -8,970.1 | -10,782.3 | -10,563.1 | 3,376.1 | -18,568.8 | -11,141.7 | -12,242.3 | -13,451.7 | -14,780.5 |
| WACC, % | 4.14 | 4.14 | 4.13 | 4.14 | 4.14 | 4.14 | 4.14 | 4.14 | 4.14 | 4.14 |
| PV UFCF | ||||||||||
| SUM PV UFCF | -62,450.6 | |||||||||
| Long Term Growth Rate, % | 3.00 | |||||||||
| Free cash flow (T + 1) | -15,224 | |||||||||
| Terminal Value | -1,337,597 | |||||||||
| Present Terminal Value | -1,092,134 | |||||||||
| Enterprise Value | -1,154,585 | |||||||||
| Net Debt | 163,603 | |||||||||
| Equity Value | -1,318,187 | |||||||||
| Diluted Shares Outstanding, MM | 1 | |||||||||
| Equity Value Per Share | -1,741,358.50 |
What You Will Receive
- Genuine Comforia Data: Preloaded financial information – encompassing metrics from revenue to EBIT – based on actual and forecasted figures.
- Comprehensive Customization: Modify all essential parameters (highlighted in yellow) such as WACC, growth %, and tax rates.
- Immediate Valuation Adjustments: Automated recalculations to evaluate the effects of changes on the fair value of Comforia Residential REIT, Inc (3282T).
- Dynamic Excel Template: Designed for quick modifications, scenario analyses, and in-depth projections.
- Efficient and Precise: Bypass the need to construct models from the ground up while ensuring accuracy and adaptability.
Key Features
- Comprehensive Financial Insights: Gain access to accurate pre-loaded historical data and future forecasts for Comforia Residential REIT, Inc (3282T).
- Tailored Forecast Assumptions: Modify yellow-highlighted fields such as WACC, growth rates, and profit margins to suit your analysis.
- Instantaneous Calculations: Enjoy automatic updates to DCF, Net Present Value (NPV), and cash flow evaluations.
- User-Friendly Dashboard: Access clear charts and summaries for a visual representation of your valuation findings.
- Designed for All Users: A straightforward, intuitive layout catering to investors, CFOs, and consultants alike.
How It Functions
- Step 1: Download the ready-to-use Excel template featuring Comforia Residential REIT, Inc's (3282T) data.
- Step 2: Navigate through the pre-filled sheets to understand the essential metrics.
- Step 3: Modify the forecasts and assumptions in the editable yellow cells (WACC, growth, margins).
- Step 4: Instantly see the updated results, including the intrinsic value of Comforia Residential REIT, Inc (3282T).
- Step 5: Use the outputs to make informed investment choices or create reports.
Why Opt for Comforia Residential REIT, Inc (3282T)?
- Time-Efficient: No need to start from scratch – our tools are immediately accessible.
- Enhanced Precision: Dependable financial metrics and calculations minimize valuation errors.
- Completely Customizable: Adjust the model to match your specific assumptions and forecasts.
- User-Friendly: Intuitive charts and outputs simplify result analysis.
- Endorsed by Professionals: Crafted for those who prioritize accuracy and functionality.
Who Can Benefit from This Product?
- Investors: Evaluate the valuation of Comforia Residential REIT, Inc (3282T) before making investment decisions.
- CFOs and Financial Analysts: Enhance valuation workflows and validate forecasts for real estate assets.
- Startup Founders: Gain insights into how significant residential REITs like Comforia are appraised.
- Consultants: Create comprehensive valuation reports for your clients in the real estate sector.
- Students and Educators: Utilize current market data to explore and instruct on valuation methodologies.
Contents of the Template
- Pre-Filled DCF Model: Comprehensive financial data for Comforia Residential REIT, Inc (3282T) ready for immediate application.
- WACC Calculator: In-depth calculations for the Weighted Average Cost of Capital.
- Financial Ratios: Analyze the profitability, leverage, and efficiency of Comforia Residential REIT, Inc (3282T).
- Editable Inputs: Modify assumptions such as growth rates, margins, and capital expenditures to align with your specific scenarios.
- Financial Statements: Access annual and quarterly reports to facilitate comprehensive analysis.
- Interactive Dashboard: Effortlessly visualize essential valuation metrics and outcomes.
Disclaimer
All information, articles, and product details provided on this website are for general informational and educational purposes only. We do not claim any ownership over, nor do we intend to infringe upon, any trademarks, copyrights, logos, brand names, or other intellectual property mentioned or depicted on this site. Such intellectual property remains the property of its respective owners, and any references here are made solely for identification or informational purposes, without implying any affiliation, endorsement, or partnership.
We make no representations or warranties, express or implied, regarding the accuracy, completeness, or suitability of any content or products presented. Nothing on this website should be construed as legal, tax, investment, financial, medical, or other professional advice. In addition, no part of this site—including articles or product references—constitutes a solicitation, recommendation, endorsement, advertisement, or offer to buy or sell any securities, franchises, or other financial instruments, particularly in jurisdictions where such activity would be unlawful.
All content is of a general nature and may not address the specific circumstances of any individual or entity. It is not a substitute for professional advice or services. Any actions you take based on the information provided here are strictly at your own risk. You accept full responsibility for any decisions or outcomes arising from your use of this website and agree to release us from any liability in connection with your use of, or reliance upon, the content or products found herein.