
|
Sieben & I Holdings Co., Ltd. (3382.t) DCF -Bewertung |
Fully Editable: Tailor To Your Needs In Excel Or Sheets
Professional Design: Trusted, Industry-Standard Templates
Investor-Approved Valuation Models
MAC/PC Compatible, Fully Unlocked
No Expertise Is Needed; Easy To Follow
Seven & i Holdings Co., Ltd. (3382.T) Bundle
Verbessern Sie Ihre Investitionsentscheidungen mit dem (3382T) DCF -Taschenrechner von sieben & I Holdings Co., Ltd.! Erforschen Sie echte Finanzdaten, passen Sie Wachstumsprojektionen und -kosten an und beachten Sie sofort, wie sich diese Veränderungen auf den inneren Wert von (3382T) auswirken.
Benefits You Will Receive
- Authentic Seven & i Data: Comprehensive financials - including revenue and EBIT - derived from real and forecasted metrics.
- Complete Customization: Tailor essential variables (highlighted cells) such as WACC, growth %, and tax rates to suit your analysis.
- Real-Time Valuation Adjustments: Automatic recalculations that allow you to assess the effects of changes on the fair value of Seven & i Holdings (3382T).
- Flexible Excel Template: Designed for quick modifications, scenario analysis, and in-depth forecasting.
- Efficient and Precise: Avoid the hassle of building models from the ground up while ensuring both accuracy and adaptability.
Key Features
- Comprehensive DCF Calculator: Features detailed unlevered and levered DCF valuation models tailored for Seven & i Holdings Co., Ltd. (3382T).
- WACC Calculator: Comes with a pre-built Weighted Average Cost of Capital sheet that allows for customizable inputs.
- Adjustable Forecast Assumptions: Easily change growth rates, capital expenditures, and discount rates to suit your analysis.
- Integrated Financial Ratios: Assess profitability, leverage, and efficiency ratios specifically for Seven & i Holdings Co., Ltd. (3382T).
- Interactive Dashboard and Charts: Visual representations summarize crucial valuation metrics for straightforward analysis.
How It Works
- Step 1: Download the Excel file for Seven & i Holdings Co., Ltd. (3382T).
- Step 2: Examine the pre-filled financial data and forecasts for Seven & i Holdings Co., Ltd. (3382T).
- Step 3: Adjust key inputs such as revenue growth, WACC, and tax rates (highlighted cells) to tailor your analysis.
- Step 4: Observe the DCF model refresh in real-time as you modify your assumptions.
- Step 5: Review the outcomes and leverage the findings for your investment strategies.
Why Opt for This Calculator?
- All-in-One Tool: Features DCF, WACC, and financial ratio analyses seamlessly integrated.
- Flexible Inputs: Modify the highlighted cells to explore different financial scenarios.
- In-Depth Analysis: Automatically computes the intrinsic value and Net Present Value for Seven & i Holdings Co., Ltd. (3382T).
- Preloaded Information: Utilizes historical and projected data for reliable baseline calculations.
- High Professional Standards: Perfect for financial analysts, investors, and business consultants alike.
Who Can Benefit from This Product?
- Investors: Evaluate the valuation of Seven & i Holdings Co., Ltd. (3382T) before making investment decisions.
- CFOs and Financial Analysts: Enhance valuation methods and validate financial forecasts.
- Startup Founders: Gain insights into how prominent corporations like Seven & i Holdings Co., Ltd. (3382T) are valued.
- Consultants: Create comprehensive valuation reports for your clients.
- Students and Educators: Leverage current data to practice and teach valuation methodologies.
Contents of the Template
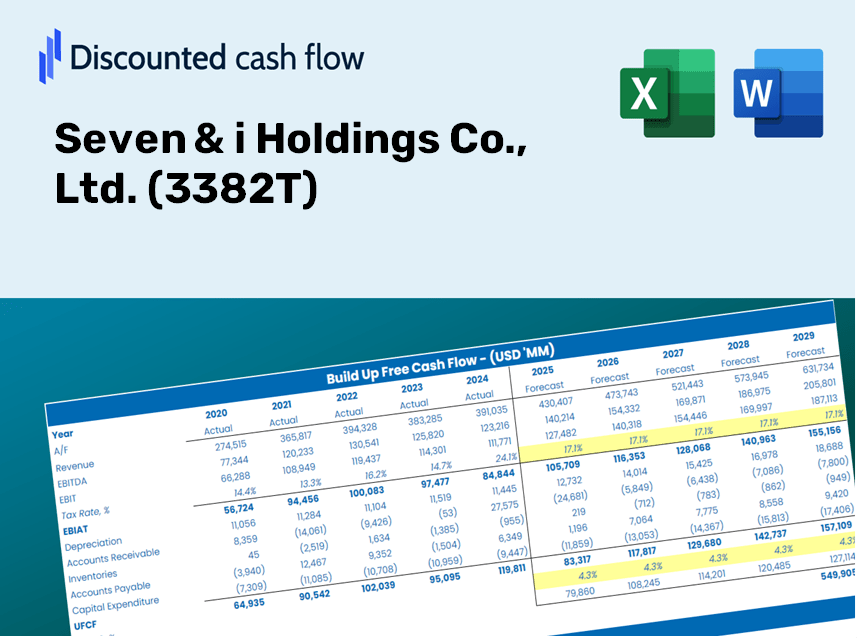
- Preloaded 3382T Data: Comprehensive historical and forecasted financial information, encompassing revenue, EBIT, and capital expenditures.
- DCF and WACC Models: Advanced spreadsheets for determining intrinsic value and calculating the Weighted Average Cost of Capital.
- Editable Inputs: Cells highlighted in yellow for modifying assumptions such as revenue growth, tax rates, and discount rates.
- Financial Statements: Detailed annual and quarterly financial statements for extensive analysis.
- Key Ratios: Metrics for profitability, leverage, and efficiency to assess operational performance.
- Dashboard and Charts: Visual representations of valuation results and underlying assumptions.
Disclaimer
All information, articles, and product details provided on this website are for general informational and educational purposes only. We do not claim any ownership over, nor do we intend to infringe upon, any trademarks, copyrights, logos, brand names, or other intellectual property mentioned or depicted on this site. Such intellectual property remains the property of its respective owners, and any references here are made solely for identification or informational purposes, without implying any affiliation, endorsement, or partnership.
We make no representations or warranties, express or implied, regarding the accuracy, completeness, or suitability of any content or products presented. Nothing on this website should be construed as legal, tax, investment, financial, medical, or other professional advice. In addition, no part of this site—including articles or product references—constitutes a solicitation, recommendation, endorsement, advertisement, or offer to buy or sell any securities, franchises, or other financial instruments, particularly in jurisdictions where such activity would be unlawful.
All content is of a general nature and may not address the specific circumstances of any individual or entity. It is not a substitute for professional advice or services. Any actions you take based on the information provided here are strictly at your own risk. You accept full responsibility for any decisions or outcomes arising from your use of this website and agree to release us from any liability in connection with your use of, or reliance upon, the content or products found herein.