
|
Toridoll Holdings Corporation (3397.t) DCF -Bewertung |
Fully Editable: Tailor To Your Needs In Excel Or Sheets
Professional Design: Trusted, Industry-Standard Templates
Investor-Approved Valuation Models
MAC/PC Compatible, Fully Unlocked
No Expertise Is Needed; Easy To Follow
TORIDOLL Holdings Corporation (3397.T) Bundle
Bewerten Sie die finanziellen Aussichten der Toridoll Holdings Corporation wie ein Experte! Dieser (3397T) DCF-Taschenrechner bietet Ihnen vorgefüllte Finanzdaten und ermöglicht es Ihnen, das Umsatzwachstum, WACC, Margen und andere wesentliche Annahmen anzupassen, um sich an Ihren Projektionen anzupassen.
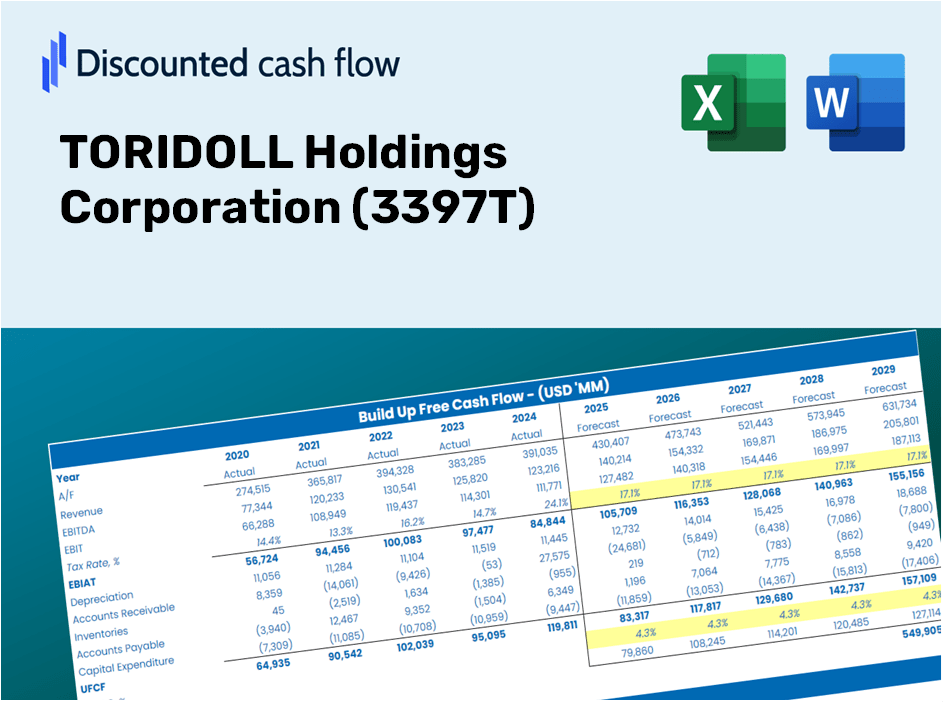
Discounted Cash Flow (DCF) - (USD MM)
| Year | AY1 2020 |
AY2 2021 |
AY3 2022 |
AY4 2023 |
AY5 2024 |
FY1 2025 |
FY2 2026 |
FY3 2027 |
FY4 2028 |
FY5 2029 |
|---|---|---|---|---|---|---|---|---|---|---|
| Revenue | 134,760.0 | 153,355.0 | 188,320.0 | 231,952.0 | 268,228.0 | 278,467.4 | 289,097.7 | 300,133.8 | 311,591.2 | 323,486.0 |
| Revenue Growth, % | 0 | 13.8 | 22.8 | 23.17 | 15.64 | 3.82 | 3.82 | 3.82 | 3.82 | 3.82 |
| EBITDA | 14,024.0 | 37,039.0 | 34,259.0 | 41,859.0 | 41,929.0 | 48,135.5 | 49,973.0 | 51,880.7 | 53,861.2 | 55,917.3 |
| EBITDA, % | 10.41 | 24.15 | 18.19 | 18.05 | 15.63 | 17.29 | 17.29 | 17.29 | 17.29 | 17.29 |
| Depreciation | 21,238.0 | 21,926.0 | 25,559.0 | 28,873.0 | 31,406.0 | 37,752.4 | 39,193.6 | 40,689.8 | 42,243.1 | 43,855.7 |
| Depreciation, % | 15.76 | 14.3 | 13.57 | 12.45 | 11.71 | 13.56 | 13.56 | 13.56 | 13.56 | 13.56 |
| EBIT | -7,214.0 | 15,113.0 | 8,700.0 | 12,986.0 | 10,523.0 | 10,383.1 | 10,779.4 | 11,190.9 | 11,618.1 | 12,061.6 |
| EBIT, % | -5.35 | 9.85 | 4.62 | 5.6 | 3.92 | 3.73 | 3.73 | 3.73 | 3.73 | 3.73 |
| Total Cash | 24,969.0 | 53,463.0 | 67,456.0 | 70,627.0 | 82,271.0 | 83,724.9 | 86,921.1 | 90,239.2 | 93,684.0 | 97,260.4 |
| Total Cash, percent | .0 | .0 | .0 | .0 | .0 | .0 | .0 | .0 | .0 | .0 |
| Account Receivables | 5,497.0 | 5,518.0 | 7,578.0 | 9,678.0 | 10,971.0 | 11,118.6 | 11,543.0 | 11,983.7 | 12,441.1 | 12,916.1 |
| Account Receivables, % | 4.08 | 3.6 | 4.02 | 4.17 | 4.09 | 3.99 | 3.99 | 3.99 | 3.99 | 3.99 |
| Inventories | 718.0 | 502.0 | 759.0 | 1,087.0 | 1,119.0 | 1,196.9 | 1,242.5 | 1,290.0 | 1,339.2 | 1,390.3 |
| Inventories, % | 0.5328 | 0.32735 | 0.40304 | 0.46863 | 0.41718 | 0.4298 | 0.4298 | 0.4298 | 0.4298 | 0.4298 |
| Accounts Payable | 3,814.0 | 3,855.0 | 4,906.0 | 16,963.0 | 17,255.0 | 12,082.8 | 12,544.1 | 13,023.0 | 13,520.1 | 14,036.2 |
| Accounts Payable, % | 2.83 | 2.51 | 2.61 | 7.31 | 6.43 | 4.34 | 4.34 | 4.34 | 4.34 | 4.34 |
| Capital Expenditure | -8,852.0 | -6,967.0 | -11,432.0 | -9,131.0 | -13,827.0 | -14,632.8 | -15,191.4 | -15,771.3 | -16,373.4 | -16,998.4 |
| Capital Expenditure, % | -6.57 | -4.54 | -6.07 | -3.94 | -5.15 | -5.25 | -5.25 | -5.25 | -5.25 | -5.25 |
| Tax Rate, % | 77.93 | 77.93 | 77.93 | 77.93 | 77.93 | 77.93 | 77.93 | 77.93 | 77.93 | 77.93 |
| EBITAT | -4,316.2 | 9,738.0 | 4,309.5 | 6,984.7 | 2,322.6 | 5,184.4 | 5,382.3 | 5,587.8 | 5,801.1 | 6,022.6 |
| Depreciation | ||||||||||
| Changes in Account Receivables | ||||||||||
| Changes in Inventories | ||||||||||
| Changes in Accounts Payable | ||||||||||
| Capital Expenditure | ||||||||||
| UFCF | 5,668.8 | 24,933.0 | 17,170.5 | 36,355.7 | 18,868.6 | 22,906.4 | 29,375.6 | 30,497.0 | 31,661.2 | 32,869.9 |
| WACC, % | 3.83 | 3.89 | 3.7 | 3.76 | 3.36 | 3.71 | 3.71 | 3.71 | 3.71 | 3.71 |
| PV UFCF | ||||||||||
| SUM PV UFCF | 131,514.9 | |||||||||
| Long Term Growth Rate, % | 3.20 | |||||||||
| Free cash flow (T + 1) | 33,922 | |||||||||
| Terminal Value | 6,691,211 | |||||||||
| Present Terminal Value | 5,577,829 | |||||||||
| Enterprise Value | 5,709,344 | |||||||||
| Net Debt | 118,611 | |||||||||
| Equity Value | 5,590,733 | |||||||||
| Diluted Shares Outstanding, MM | 88 | |||||||||
| Equity Value Per Share | 63,444.55 |
What You Will Receive
- Authentic (3397T) Financial Data: Pre-loaded with TORIDOLL Holdings Corporation’s historical and forecasted data for accurate analysis.
- Completely Customizable Template: Effortlessly adjust essential inputs such as revenue growth, WACC, and EBITDA percentage.
- Instantaneous Calculations: Watch the intrinsic value of TORIDOLL Holdings Corporation update in real-time as you make adjustments.
- Advanced Valuation Tool: Tailored for investors, analysts, and consultants in need of reliable DCF outcomes.
- Intuitive Layout: Clear organization and straightforward guidance suitable for all levels of expertise.
Main Features
- Authentic TORIDOLL Financial Data: Gain access to precise historical figures and future forecasts.
- Adjustable Forecast Parameters: Modify highlighted cells for WACC, growth rates, and profit margins.
- Instantaneous Calculations: Automatic recalculations for DCF, Net Present Value (NPV), and cash flow assessments.
- User-Friendly Dashboard: Clear and concise charts for easy visualization of your valuation outcomes.
- Suitable for All Levels: A straightforward layout designed for investors, CFOs, and consultants alike.
How It Operates
- 1. Access the Template: Download and open the Excel file containing TORIDOLL Holdings Corporation’s (3397T) preloaded data.
- 2. Modify Assumptions: Adjust key parameters such as growth rates, WACC, and capital expenditures as needed.
- 3. Instantly View Results: The DCF model automatically computes the intrinsic value and NPV in real-time.
- 4. Explore Scenarios: Analyze various forecasts to evaluate different valuation results.
- 5. Present with Assurance: Share professional valuation findings to back your strategic decisions.
Why Choose the TORIDOLL Holdings Corporation ([3397T]) Calculator?
- Accurate Financial Insights: Utilize real TORIDOLL financial data for dependable valuation outcomes.
- Fully Customizable: Modify essential parameters such as growth rates, WACC, and tax rates to fit your forecasts.
- Efficient: Built-in calculations save you the hassle of starting from the ground up.
- Professional-Quality Tool: Tailored for investors, analysts, and consultants in the field.
- Easy to Use: Clear layout and comprehensive instructions ensure accessibility for all users.
Who Should Use This Product?
- Investors: Precisely assess the fair value of TORIDOLL Holdings Corporation (3397T) prior to making investment choices.
- CFOs: Utilize a professional-grade DCF model for accurate financial reporting and analysis.
- Consultants: Efficiently customize the template for valuation reports tailored to clients.
- Entrepreneurs: Discover financial modeling techniques employed by industry leaders.
- Educators: Employ it as a valuable resource to illustrate valuation methodologies in the classroom.
Contents of the Template
- Historical Data: Provides TORIDOLL Holdings Corporation's (3397T) previous financial results and foundational forecasts.
- DCF and Levered DCF Models: Comprehensive templates designed to assess the intrinsic value of TORIDOLL Holdings Corporation (3397T).
- WACC Sheet: Pre-configured calculations for the Weighted Average Cost of Capital.
- Editable Inputs: Customize critical drivers such as growth rates, EBITDA percentages, and capital expenditure assumptions.
- Quarterly and Annual Statements: An exhaustive analysis of TORIDOLL Holdings Corporation's (3397T) financial performance.
- Interactive Dashboard: Dynamically visualize valuation outcomes and forecasts.
Disclaimer
All information, articles, and product details provided on this website are for general informational and educational purposes only. We do not claim any ownership over, nor do we intend to infringe upon, any trademarks, copyrights, logos, brand names, or other intellectual property mentioned or depicted on this site. Such intellectual property remains the property of its respective owners, and any references here are made solely for identification or informational purposes, without implying any affiliation, endorsement, or partnership.
We make no representations or warranties, express or implied, regarding the accuracy, completeness, or suitability of any content or products presented. Nothing on this website should be construed as legal, tax, investment, financial, medical, or other professional advice. In addition, no part of this site—including articles or product references—constitutes a solicitation, recommendation, endorsement, advertisement, or offer to buy or sell any securities, franchises, or other financial instruments, particularly in jurisdictions where such activity would be unlawful.
All content is of a general nature and may not address the specific circumstances of any individual or entity. It is not a substitute for professional advice or services. Any actions you take based on the information provided here are strictly at your own risk. You accept full responsibility for any decisions or outcomes arising from your use of this website and agree to release us from any liability in connection with your use of, or reliance upon, the content or products found herein.