
|
Peking Tong Ren Tang Chinese Medicine Company Limited (3613.HK) DCF -Bewertung |
Fully Editable: Tailor To Your Needs In Excel Or Sheets
Professional Design: Trusted, Industry-Standard Templates
Investor-Approved Valuation Models
MAC/PC Compatible, Fully Unlocked
No Expertise Is Needed; Easy To Follow
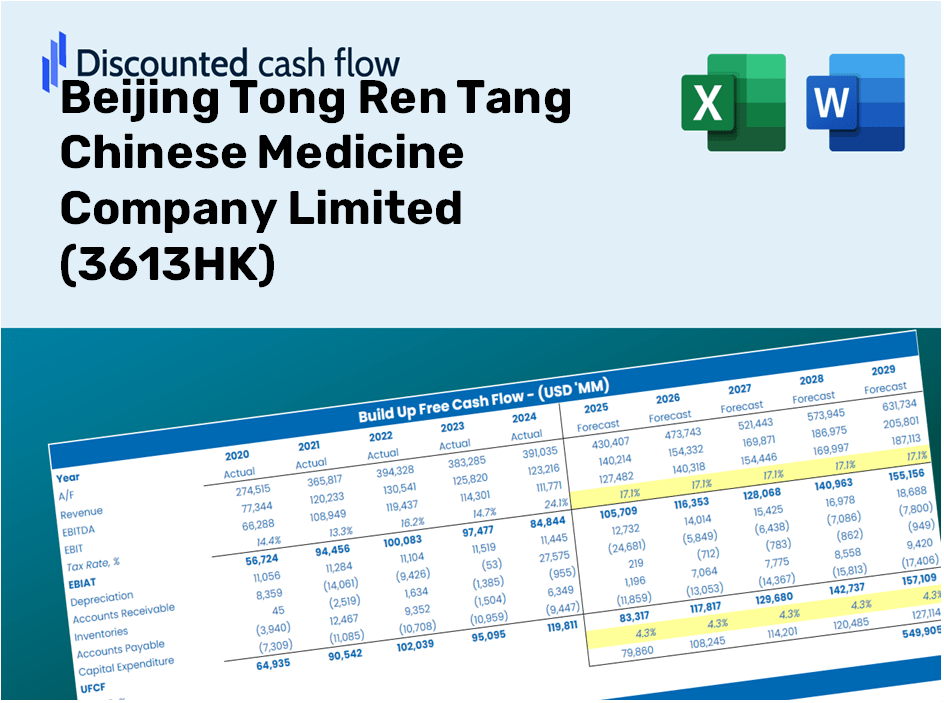
Beijing Tong Ren Tang Chinese Medicine Company Limited (3613.HK) Bundle
Vereinfachen Sie die Bewertung von Peking Tong Ren Tang Chinese Medicine Company Limited (3613HK) mit diesem anpassbaren DCF -Taschenrechner! Mit Real Peking Tong Ren Tang Chinese Medicine Company Limited (3613HK) Finanzdaten und einstellbaren prognostizierenden Inputs können Sie Szenarien testen und die faire Werte von Peking Tong Ren Tang Chinese Medicine Company (3613HK) in Minuten aufdecken.
Discounted Cash Flow (DCF) - (USD MM)
| Year | AY1 2020 |
AY2 2021 |
AY3 2022 |
AY4 2023 |
AY5 2024 |
FY1 2025 |
FY2 2026 |
FY3 2027 |
FY4 2028 |
FY5 2029 |
|---|---|---|---|---|---|---|---|---|---|---|
| Revenue | 1,315.3 | 1,556.2 | 1,731.1 | 1,524.9 | 1,611.6 | 1,705.6 | 1,805.1 | 1,910.4 | 2,021.8 | 2,139.7 |
| Revenue Growth, % | 0 | 18.31 | 11.24 | -11.91 | 5.69 | 5.83 | 5.83 | 5.83 | 5.83 | 5.83 |
| EBITDA | 769.1 | 852.8 | 907.6 | 779.5 | 722.3 | 892.5 | 944.6 | 999.7 | 1,058.0 | 1,119.7 |
| EBITDA, % | 58.47 | 54.8 | 52.43 | 51.12 | 44.82 | 52.33 | 52.33 | 52.33 | 52.33 | 52.33 |
| Depreciation | 78.1 | 70.0 | 75.5 | 82.5 | 88.1 | 87.6 | 92.7 | 98.1 | 103.8 | 109.9 |
| Depreciation, % | 5.94 | 4.5 | 4.36 | 5.41 | 5.47 | 5.13 | 5.13 | 5.13 | 5.13 | 5.13 |
| EBIT | 691.1 | 782.8 | 832.2 | 697.0 | 634.2 | 805.0 | 851.9 | 901.6 | 954.2 | 1,009.8 |
| EBIT, % | 52.54 | 50.31 | 48.07 | 45.71 | 39.35 | 47.19 | 47.19 | 47.19 | 47.19 | 47.19 |
| Total Cash | 1,847.1 | 2,275.6 | 2,244.0 | 2,378.7 | 1,819.8 | 1,705.6 | 1,805.1 | 1,910.4 | 2,021.8 | 2,139.7 |
| Total Cash, percent | .0 | .0 | .0 | .0 | .0 | .0 | .0 | .0 | .0 | .0 |
| Account Receivables | 547.4 | 527.4 | 942.0 | 423.0 | 526.0 | 649.2 | 687.0 | 727.1 | 769.5 | 814.4 |
| Account Receivables, % | 41.62 | 33.89 | 54.42 | 27.74 | 32.64 | 38.06 | 38.06 | 38.06 | 38.06 | 38.06 |
| Inventories | 495.4 | 431.9 | 469.8 | 1,011.6 | 1,589.0 | 878.4 | 929.6 | 983.8 | 1,041.2 | 1,101.9 |
| Inventories, % | 37.66 | 27.75 | 27.14 | 66.34 | 98.6 | 51.5 | 51.5 | 51.5 | 51.5 | 51.5 |
| Accounts Payable | 74.1 | 34.6 | 153.7 | 177.0 | 38.3 | 104.8 | 110.9 | 117.4 | 124.2 | 131.5 |
| Accounts Payable, % | 5.64 | 2.22 | 8.88 | 11.61 | 2.38 | 6.14 | 6.14 | 6.14 | 6.14 | 6.14 |
| Capital Expenditure | -12.9 | -23.4 | -38.5 | -21.9 | -43.2 | -30.1 | -31.8 | -33.7 | -35.7 | -37.8 |
| Capital Expenditure, % | -0.97921 | -1.51 | -2.22 | -1.43 | -2.68 | -1.76 | -1.76 | -1.76 | -1.76 | -1.76 |
| Tax Rate, % | 20.56 | 20.56 | 20.56 | 20.56 | 20.56 | 20.56 | 20.56 | 20.56 | 20.56 | 20.56 |
| EBITAT | 546.5 | 611.3 | 650.7 | 547.7 | 503.8 | 633.3 | 670.3 | 709.3 | 750.7 | 794.5 |
| Depreciation | ||||||||||
| Changes in Account Receivables | ||||||||||
| Changes in Inventories | ||||||||||
| Changes in Accounts Payable | ||||||||||
| Capital Expenditure | ||||||||||
| UFCF | -356.9 | 701.8 | 354.3 | 608.7 | -270.3 | 1,344.7 | 648.1 | 685.9 | 725.9 | 768.2 |
| WACC, % | 5.87 | 5.87 | 5.87 | 5.87 | 5.87 | 5.87 | 5.87 | 5.87 | 5.87 | 5.87 |
| PV UFCF | ||||||||||
| SUM PV UFCF | 3,582.0 | |||||||||
| Long Term Growth Rate, % | 2.00 | |||||||||
| Free cash flow (T + 1) | 784 | |||||||||
| Terminal Value | 20,253 | |||||||||
| Present Terminal Value | 15,228 | |||||||||
| Enterprise Value | 18,810 | |||||||||
| Net Debt | -1,650 | |||||||||
| Equity Value | 20,460 | |||||||||
| Diluted Shares Outstanding, MM | 837 | |||||||||
| Equity Value Per Share | 24.44 |
What You Will Receive
- Pre-Filled Financial Model: Leverage Beijing Tong Ren Tang's (3613HK) actual data for accurate DCF valuation.
- Comprehensive Forecast Control: Modify revenue growth, profit margins, WACC, and other essential drivers.
- Real-Time Calculations: Automatic updates display results instantly as you make adjustments.
- Investor-Ready Template: A polished Excel file crafted for high-quality valuation presentations.
- Flexible and Reusable: Designed for customization, enabling repeated use for in-depth forecasting.
Key Features
- Comprehensive DCF Calculator: Features detailed unlevered and levered DCF valuation models tailored for Beijing Tong Ren Tang Chinese Medicine Company Limited (3613HK).
- WACC Calculator: Comes with a pre-built Weighted Average Cost of Capital sheet, allowing for customizable inputs specific to (3613HK).
- Flexible Forecast Assumptions: Adjust growth rates, capital expenditures, and discount rates to fit the projections for (3613HK).
- Integrated Financial Ratios: Evaluate key profitability, leverage, and efficiency metrics relevant to Beijing Tong Ren Tang Chinese Medicine Company Limited (3613HK).
- Visual Dashboard and Charts: Provides visual representations to summarize essential valuation metrics for straightforward analysis of (3613HK).
How It Functions
- Download: Get the pre-prepared Excel file containing Beijing Tong Ren Tang Chinese Medicine Company Limited’s (3613HK) financial data.
- Customize: Modify forecasts, such as revenue growth, EBITDA %, and WACC.
- Update Automatically: The intrinsic value and NPV calculations refresh in real-time.
- Test Scenarios: Develop multiple projections and compare results instantly.
- Make Decisions: Leverage the valuation outcomes to inform your investment strategy.
Why Select This Calculator for Beijing Tong Ren Tang Chinese Medicine Company Limited (3613HK)?
- All-in-One Solution: Combines DCF, WACC, and financial ratio analysis seamlessly.
- Adjustable Parameters: Modify the highlighted cells to explore different financial scenarios.
- In-Depth Analysis: Automatically computes the intrinsic value and Net Present Value for Beijing Tong Ren Tang.
- Preloaded Information: Features historical and projected data for reliable starting points.
- Professional Grade: Perfect for analysts, investors, and consultants in the financial sector.
Who Should Utilize This Product?
- Investors: Make informed decisions with a top-tier valuation tool tailored for the market.
- Financial Analysts: Streamline your process with a customizable DCF model at your fingertips.
- Consultants: Effortlessly modify the template for presentations or reports tailored to clients.
- Finance Enthusiasts: Enhance your knowledge of valuation methodologies through real-world case studies.
- Educators and Students: Employ this as a hands-on resource in finance-related educational settings.
Note: This product is specifically designed for Beijing Tong Ren Tang Chinese Medicine Company Limited (3613HK).
What This Template Includes
- Comprehensive DCF Model: An editable template featuring detailed valuation calculations.
- Real-World Data: Historical and projected financials of Beijing Tong Ren Tang Chinese Medicine Company Limited (3613HK) preloaded for analysis.
- Customizable Parameters: Adjust WACC, growth rates, and tax assumptions to evaluate different scenarios.
- Financial Statements: Complete annual and quarterly breakdowns for enhanced insights.
- Key Ratios: Integrated analysis covering profitability, efficiency, and leverage metrics.
- Dashboard with Visual Outputs: Visual tools such as charts and tables to present clear, actionable results.
Disclaimer
All information, articles, and product details provided on this website are for general informational and educational purposes only. We do not claim any ownership over, nor do we intend to infringe upon, any trademarks, copyrights, logos, brand names, or other intellectual property mentioned or depicted on this site. Such intellectual property remains the property of its respective owners, and any references here are made solely for identification or informational purposes, without implying any affiliation, endorsement, or partnership.
We make no representations or warranties, express or implied, regarding the accuracy, completeness, or suitability of any content or products presented. Nothing on this website should be construed as legal, tax, investment, financial, medical, or other professional advice. In addition, no part of this site—including articles or product references—constitutes a solicitation, recommendation, endorsement, advertisement, or offer to buy or sell any securities, franchises, or other financial instruments, particularly in jurisdictions where such activity would be unlawful.
All content is of a general nature and may not address the specific circumstances of any individual or entity. It is not a substitute for professional advice or services. Any actions you take based on the information provided here are strictly at your own risk. You accept full responsibility for any decisions or outcomes arising from your use of this website and agree to release us from any liability in connection with your use of, or reliance upon, the content or products found herein.