
|
Nexon Co., Ltd. (3659.t) DCF -Bewertung |
Fully Editable: Tailor To Your Needs In Excel Or Sheets
Professional Design: Trusted, Industry-Standard Templates
Investor-Approved Valuation Models
MAC/PC Compatible, Fully Unlocked
No Expertise Is Needed; Easy To Follow
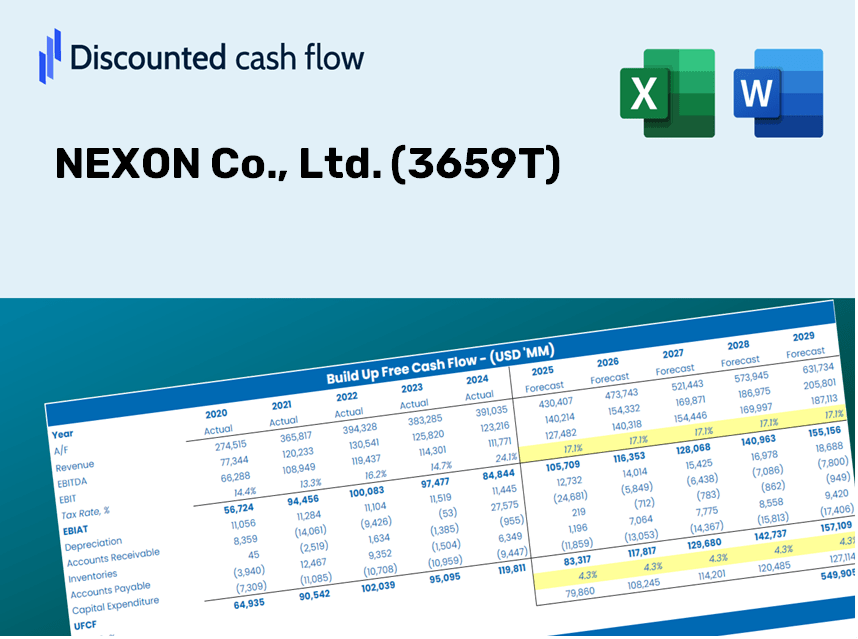
NEXON Co., Ltd. (3659.T) Bundle
Gewinnen Sie Einblicke in Ihre Nexon Co., Ltd. (3659T) Bewertungsanalyse mit unserem DCF-Taschenrechner des hochmodernen DCF! Diese Excel -Vorlage wird mit realen (3659T) Daten vorinstalliert, sodass Sie Prognosen und Annahmen für genaue Berechnungen des intrinsischen Wertes von Nexon anpassen können.
Discounted Cash Flow (DCF) - (USD MM)
| Year | AY1 2020 |
AY2 2021 |
AY3 2022 |
AY4 2023 |
AY5 2024 |
FY1 2025 |
FY2 2026 |
FY3 2027 |
FY4 2028 |
FY5 2029 |
|---|---|---|---|---|---|---|---|---|---|---|
| Revenue | 293,024.0 | 274,462.0 | 353,714.0 | 423,356.0 | 446,211.0 | 458,046.5 | 470,195.8 | 482,667.5 | 495,469.9 | 508,611.9 |
| Revenue Growth, % | 0 | -6.33 | 28.88 | 19.69 | 5.4 | 2.65 | 2.65 | 2.65 | 2.65 | 2.65 |
| EBITDA | 117,008.0 | 145,295.0 | 158,302.0 | 139,447.0 | 134,318.0 | 183,826.8 | 188,702.7 | 193,707.9 | 198,845.9 | 204,120.1 |
| EBITDA, % | 39.93 | 52.94 | 44.75 | 32.94 | 30.1 | 40.13 | 40.13 | 40.13 | 40.13 | 40.13 |
| Depreciation | 8,574.0 | 8,468.0 | 6,767.0 | 8,598.0 | 10,142.0 | 11,202.3 | 11,499.4 | 11,804.4 | 12,117.5 | 12,438.9 |
| Depreciation, % | 2.93 | 3.09 | 1.91 | 2.03 | 2.27 | 2.45 | 2.45 | 2.45 | 2.45 | 2.45 |
| EBIT | 108,434.0 | 136,827.0 | 151,535.0 | 130,849.0 | 124,176.0 | 172,624.5 | 177,203.3 | 181,903.5 | 186,728.4 | 191,681.2 |
| EBIT, % | 37.01 | 49.85 | 42.84 | 30.91 | 27.83 | 37.69 | 37.69 | 37.69 | 37.69 | 37.69 |
| Total Cash | 525,702.0 | 534,928.0 | 571,858.0 | 596,758.0 | 600,865.0 | 458,046.5 | 470,195.8 | 482,667.5 | 495,469.9 | 508,611.9 |
| Total Cash, percent | .0 | .0 | .0 | .0 | .0 | .0 | .0 | .0 | .0 | .0 |
| Account Receivables | 20,935.0 | 17,577.0 | 30,444.0 | 37,873.0 | 88,717.0 | 46,705.9 | 47,944.7 | 49,216.4 | 50,521.9 | 51,861.9 |
| Account Receivables, % | 7.14 | 6.4 | 8.61 | 8.95 | 19.88 | 10.2 | 10.2 | 10.2 | 10.2 | 10.2 |
| Inventories | 273,132.0 | 169,689.0 | 162,490.0 | .0 | .0 | 184,112.5 | 188,995.9 | 194,008.9 | 199,154.9 | 204,437.3 |
| Inventories, % | 93.21 | 61.83 | 45.94 | 0 | 0 | 40.2 | 40.2 | 40.2 | 40.2 | 40.2 |
| Accounts Payable | 10,668.0 | 9,354.0 | 14,705.0 | 16,332.0 | 4,412.0 | 14,705.7 | 15,095.7 | 15,496.1 | 15,907.2 | 16,329.1 |
| Accounts Payable, % | 3.64 | 3.41 | 4.16 | 3.86 | 0.98877 | 3.21 | 3.21 | 3.21 | 3.21 | 3.21 |
| Capital Expenditure | -3,232.0 | -1,585.0 | -5,902.0 | -5,713.0 | -3,639.0 | -5,051.4 | -5,185.4 | -5,322.9 | -5,464.1 | -5,609.0 |
| Capital Expenditure, % | -1.1 | -0.57749 | -1.67 | -1.35 | -0.81553 | -1.1 | -1.1 | -1.1 | -1.1 | -1.1 |
| Tax Rate, % | 31.2 | 31.2 | 31.2 | 31.2 | 31.2 | 31.2 | 31.2 | 31.2 | 31.2 | 31.2 |
| EBITAT | 56,356.7 | 116,037.1 | 108,200.5 | 73,367.7 | 85,438.8 | 114,987.6 | 118,037.6 | 121,168.5 | 124,382.4 | 127,681.5 |
| Depreciation | ||||||||||
| Changes in Account Receivables | ||||||||||
| Changes in Inventories | ||||||||||
| Changes in Accounts Payable | ||||||||||
| Capital Expenditure | ||||||||||
| UFCF | -221,700.3 | 228,407.1 | 108,748.5 | 232,940.7 | 29,177.8 | -10,669.2 | 118,619.4 | 121,765.7 | 124,995.4 | 128,310.9 |
| WACC, % | 5.95 | 6 | 5.98 | 5.96 | 5.98 | 5.97 | 5.97 | 5.97 | 5.97 | 5.97 |
| PV UFCF | ||||||||||
| SUM PV UFCF | 392,978.6 | |||||||||
| Long Term Growth Rate, % | 2.00 | |||||||||
| Free cash flow (T + 1) | 130,877 | |||||||||
| Terminal Value | 3,293,796 | |||||||||
| Present Terminal Value | 2,464,402 | |||||||||
| Enterprise Value | 2,857,380 | |||||||||
| Net Debt | -291,933 | |||||||||
| Equity Value | 3,149,313 | |||||||||
| Diluted Shares Outstanding, MM | 837 | |||||||||
| Equity Value Per Share | 3,762.18 |
What You Will Receive
- Pre-Filled Financial Model: NEXON's actual data facilitates accurate DCF valuation.
- Comprehensive Forecast Control: Modify revenue growth, profit margins, WACC, and other essential variables.
- Real-Time Calculations: Automatic updates provide immediate results as you make adjustments.
- Professional-Grade Template: An expertly crafted Excel file prepared for investor presentations.
- Flexible and Repeatable: Designed for adaptability, allowing continued use for in-depth forecasting.
Key Features
- Pre-Loaded Data: NEXON Co., Ltd.'s historical financial statements and pre-filled forecasts.
- Fully Adjustable Inputs: Modify WACC, tax rates, revenue growth, and EBITDA margins as needed.
- Instant Results: Watch NEXON Co., Ltd.'s intrinsic value update in real time.
- Clear Visual Outputs: Visual dashboards present valuation results and essential metrics.
- Built for Accuracy: A sophisticated tool designed for analysts, investors, and finance professionals.
How It Works
- Download: Get the pre-built Excel file featuring NEXON Co., Ltd. (3659T) financial data.
- Customize: Tailor your forecasts, including revenue growth, EBITDA %, and WACC to your needs.
- Update Automatically: Watch as intrinsic value and NPV calculations refresh in real-time.
- Test Scenarios: Generate various projections and instantly compare the results.
- Make Decisions: Utilize the valuation findings to inform your investment approach.
Why Choose NEXON's Calculator?
- Precision: Reliable NEXON financials guarantee data integrity.
- Adaptability: Built for users to easily customize and experiment with inputs.
- Efficiency: Eliminate the need to create a DCF model from the ground up.
- Expert-Quality: Crafted with the accuracy and functionality expected from top-tier financial professionals.
- Intuitive: Simple to navigate, even for those without extensive financial modeling knowledge.
Who Can Benefit from This Product?
- Investors: Evaluate NEXON Co., Ltd.'s ([3659T]) valuation prior to making stock trades.
- CFOs and Financial Analysts: Optimize valuation workflows and assess financial forecasts for NEXON Co., Ltd. ([3659T]).
- Startup Founders: Gain insights into the valuation methods used for significant publicly traded companies like NEXON Co., Ltd. ([3659T]).
- Consultants: Create comprehensive valuation reports for clients focusing on NEXON Co., Ltd. ([3659T]).
- Students and Educators: Utilize real-time data from NEXON Co., Ltd. ([3659T]) to enhance learning and practice valuation strategies.
Contents of the Template
- Historical Data: Contains NEXON Co., Ltd.'s (3659T) previous financials and foundational forecasts.
- DCF and Levered DCF Models: Comprehensive templates designed to assess NEXON Co., Ltd.'s (3659T) intrinsic value.
- WACC Sheet: Pre-configured calculations for Weighted Average Cost of Capital.
- Editable Inputs: Customize essential drivers such as growth rates, EBITDA %, and CAPEX assumptions.
- Quarterly and Annual Statements: A thorough breakdown of NEXON Co., Ltd.'s (3659T) financial performance.
- Interactive Dashboard: Visualize valuation outcomes and projections in a dynamic format.
Disclaimer
All information, articles, and product details provided on this website are for general informational and educational purposes only. We do not claim any ownership over, nor do we intend to infringe upon, any trademarks, copyrights, logos, brand names, or other intellectual property mentioned or depicted on this site. Such intellectual property remains the property of its respective owners, and any references here are made solely for identification or informational purposes, without implying any affiliation, endorsement, or partnership.
We make no representations or warranties, express or implied, regarding the accuracy, completeness, or suitability of any content or products presented. Nothing on this website should be construed as legal, tax, investment, financial, medical, or other professional advice. In addition, no part of this site—including articles or product references—constitutes a solicitation, recommendation, endorsement, advertisement, or offer to buy or sell any securities, franchises, or other financial instruments, particularly in jurisdictions where such activity would be unlawful.
All content is of a general nature and may not address the specific circumstances of any individual or entity. It is not a substitute for professional advice or services. Any actions you take based on the information provided here are strictly at your own risk. You accept full responsibility for any decisions or outcomes arising from your use of this website and agree to release us from any liability in connection with your use of, or reliance upon, the content or products found herein.