
|
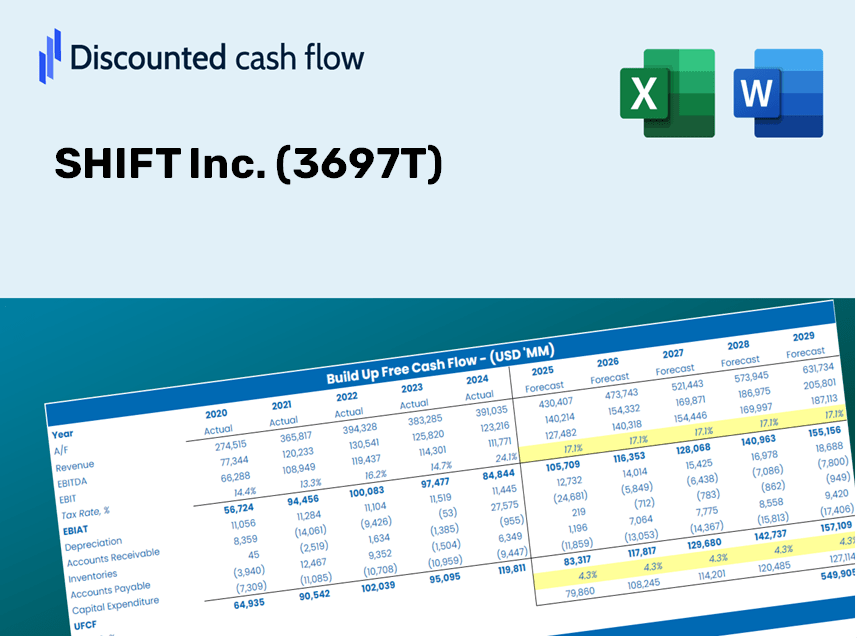
Shift Inc. (3697.t) DCF -Bewertung |
Fully Editable: Tailor To Your Needs In Excel Or Sheets
Professional Design: Trusted, Industry-Standard Templates
Investor-Approved Valuation Models
MAC/PC Compatible, Fully Unlocked
No Expertise Is Needed; Easy To Follow
SHIFT Inc. (3697.T) Bundle
Möchten Sie den inneren Wert von Shift Inc. beurteilen? Unser (3697T) DCF-Taschenrechner integriert reale Daten mit umfangreichen Anpassungsfunktionen, sodass Sie Ihre Prognosen verfeinern und Ihre Anlagestrategien verbessern können.
Discounted Cash Flow (DCF) - (USD MM)
| Year | AY1 2020 |
AY2 2021 |
AY3 2022 |
AY4 2023 |
AY5 2024 |
FY1 2025 |
FY2 2026 |
FY3 2027 |
FY4 2028 |
FY5 2029 |
|---|---|---|---|---|---|---|---|---|---|---|
| Revenue | 28,712.2 | 46,004.6 | 64,873.2 | 88,030.0 | 110,627.0 | 155,598.7 | 218,852.1 | 307,819.0 | 432,952.4 | 608,954.7 |
| Revenue Growth, % | 0 | 60.23 | 41.01 | 35.7 | 25.67 | 40.65 | 40.65 | 40.65 | 40.65 | 40.65 |
| EBITDA | 3,138.3 | 5,806.0 | 8,932.5 | 11,892.0 | 11,976.0 | 19,186.7 | 26,986.4 | 37,956.8 | 53,386.8 | 75,089.5 |
| EBITDA, % | 10.93 | 12.62 | 13.77 | 13.51 | 10.83 | 12.33 | 12.33 | 12.33 | 12.33 | 12.33 |
| Depreciation | 592.7 | 1,204.0 | 1,457.3 | 1,720.0 | 2,886.0 | 3,575.8 | 5,029.4 | 7,073.9 | 9,949.6 | 13,994.2 |
| Depreciation, % | 2.06 | 2.62 | 2.25 | 1.95 | 2.61 | 2.3 | 2.3 | 2.3 | 2.3 | 2.3 |
| EBIT | 2,545.6 | 4,602.1 | 7,475.2 | 10,172.0 | 9,090.0 | 15,610.9 | 21,957.0 | 30,882.9 | 43,437.3 | 61,095.3 |
| EBIT, % | 8.87 | 10 | 11.52 | 11.56 | 8.22 | 10.03 | 10.03 | 10.03 | 10.03 | 10.03 |
| Total Cash | 6,524.0 | 14,247.5 | 12,921.9 | 17,591.0 | 20,869.0 | 34,996.5 | 49,223.2 | 69,233.3 | 97,377.7 | 136,963.3 |
| Total Cash, percent | .0 | .0 | .0 | .0 | .0 | .0 | .0 | .0 | .0 | .0 |
| Account Receivables | 3,816.4 | 5,938.0 | 7,978.4 | 11,039.0 | 13,792.0 | 19,762.6 | 27,796.5 | 39,096.2 | 54,989.4 | 77,343.5 |
| Account Receivables, % | 13.29 | 12.91 | 12.3 | 12.54 | 12.47 | 12.7 | 12.7 | 12.7 | 12.7 | 12.7 |
| Inventories | 383.4 | 603.9 | 799.2 | 733.0 | 977.0 | 1,741.4 | 2,449.3 | 3,445.0 | 4,845.5 | 6,815.2 |
| Inventories, % | 1.34 | 1.31 | 1.23 | 0.83267 | 0.88315 | 1.12 | 1.12 | 1.12 | 1.12 | 1.12 |
| Accounts Payable | 426.6 | 1,291.7 | 1,554.0 | 1,530.0 | 1,509.0 | 3,046.9 | 4,285.5 | 6,027.6 | 8,478.0 | 11,924.4 |
| Accounts Payable, % | 1.49 | 2.81 | 2.4 | 1.74 | 1.36 | 1.96 | 1.96 | 1.96 | 1.96 | 1.96 |
| Capital Expenditure | -483.6 | -435.7 | -768.8 | -1,256.0 | -5,652.0 | -3,221.6 | -4,531.2 | -6,373.2 | -8,964.1 | -12,608.1 |
| Capital Expenditure, % | -1.68 | -0.94709 | -1.19 | -1.43 | -5.11 | -2.07 | -2.07 | -2.07 | -2.07 | -2.07 |
| Tax Rate, % | 43.24 | 43.24 | 43.24 | 43.24 | 43.24 | 43.24 | 43.24 | 43.24 | 43.24 | 43.24 |
| EBITAT | 1,655.5 | 2,866.1 | 4,983.7 | 6,256.7 | 5,159.9 | 9,749.2 | 13,712.4 | 19,286.8 | 27,127.2 | 38,154.8 |
| Depreciation | ||||||||||
| Changes in Account Receivables | ||||||||||
| Changes in Inventories | ||||||||||
| Changes in Accounts Payable | ||||||||||
| Capital Expenditure | ||||||||||
| UFCF | -2,008.7 | 2,157.4 | 3,698.9 | 3,702.3 | -624.1 | 4,906.3 | 6,707.5 | 9,434.2 | 13,269.3 | 18,663.5 |
| WACC, % | 7.4 | 7.37 | 7.42 | 7.36 | 7.3 | 7.37 | 7.37 | 7.37 | 7.37 | 7.37 |
| PV UFCF | ||||||||||
| SUM PV UFCF | 41,071.1 | |||||||||
| Long Term Growth Rate, % | 3.50 | |||||||||
| Free cash flow (T + 1) | 19,317 | |||||||||
| Terminal Value | 498,964 | |||||||||
| Present Terminal Value | 349,645 | |||||||||
| Enterprise Value | 390,716 | |||||||||
| Net Debt | -11,292 | |||||||||
| Equity Value | 402,008 | |||||||||
| Diluted Shares Outstanding, MM | 18 | |||||||||
| Equity Value Per Share | 22,827.22 |
What You Will Receive
- Authentic SHIFT Inc. Financial Data: Pre-loaded with historical and projected figures for comprehensive analysis.
- Completely Customizable Template: Easily adjust essential inputs like revenue growth, WACC, and EBITDA percentage.
- Instant Calculations: Watch the intrinsic value of SHIFT Inc. update in real time as you make changes.
- Expert Valuation Tool: Tailored for investors, analysts, and consultants seeking precise DCF outcomes.
- Intuitive Design: Straightforward format and clear guidance suitable for all skill levels.
Core Features
- Real-Time SHIFT Data: Comes pre-loaded with SHIFT Inc.'s historical performance metrics and future growth forecasts.
- Fully Adjustable Parameters: Tailor revenue growth, profit margins, discount rates, tax levels, and capital investment figures to suit your analysis.
- Interactive Valuation Tool: Instant recalculations of Net Present Value (NPV) and intrinsic value based on your customized inputs.
- Scenario Analysis: Develop various forecasting scenarios to evaluate different potential valuation results.
- Intuitive Interface: Designed to be straightforward and accessible for both seasoned professionals and newcomers.
How It Operates
- Download the Template: Gain immediate access to the Excel-based SHIFT Inc. DCF Calculator.
- Enter Your Assumptions: Modify the yellow-highlighted cells for growth rates, WACC, margins, and other variables.
- Automatic Calculations: The model will instantly refresh SHIFT Inc.'s intrinsic value.
- Explore Scenarios: Experiment with different assumptions to assess potential changes in valuation.
- Evaluate and Decide: Use the findings to inform your investment or financial decisions.
Why Opt for SHIFT Inc. (3697T) Calculator?
- Time-Efficient: Skip the hassle of building a DCF model from the ground up – it’s instantly accessible.
- Enhanced Accuracy: Dependable financial data and calculations minimize valuation errors.
- Completely Customizable: Adjust the model to align with your specific assumptions and forecasts.
- User-Friendly: Intuitive charts and outputs simplify result interpretation.
- Endorsed by Professionals: Crafted for experts who prioritize accuracy and functionality.
Who Can Benefit from SHIFT Inc. (3697T)?
- Investors: Accurately assess the fair value of SHIFT Inc. (3697T) prior to making investment choices.
- CFOs: Utilize a top-tier DCF model for comprehensive financial reporting and analysis.
- Consultants: Efficiently customize the template for client valuation reports.
- Entrepreneurs: Acquire insights into financial modeling practices of leading companies.
- Educators: Implement it as a teaching resource to illustrate valuation techniques.
Contents of the Template
- Historical Data: Contains SHIFT Inc.'s past financial performance and foundational forecasts.
- DCF and Levered DCF Models: Comprehensive templates for assessing SHIFT Inc.'s intrinsic value.
- WACC Sheet: Ready-made calculations for Weighted Average Cost of Capital.
- Editable Inputs: Adjust essential variables such as growth rates, EBITDA %, and CAPEX projections.
- Quarterly and Annual Statements: Detailed analysis of SHIFT Inc.'s financial data.
- Interactive Dashboard: Dynamically visualize valuation outcomes and forecasts.
Disclaimer
All information, articles, and product details provided on this website are for general informational and educational purposes only. We do not claim any ownership over, nor do we intend to infringe upon, any trademarks, copyrights, logos, brand names, or other intellectual property mentioned or depicted on this site. Such intellectual property remains the property of its respective owners, and any references here are made solely for identification or informational purposes, without implying any affiliation, endorsement, or partnership.
We make no representations or warranties, express or implied, regarding the accuracy, completeness, or suitability of any content or products presented. Nothing on this website should be construed as legal, tax, investment, financial, medical, or other professional advice. In addition, no part of this site—including articles or product references—constitutes a solicitation, recommendation, endorsement, advertisement, or offer to buy or sell any securities, franchises, or other financial instruments, particularly in jurisdictions where such activity would be unlawful.
All content is of a general nature and may not address the specific circumstances of any individual or entity. It is not a substitute for professional advice or services. Any actions you take based on the information provided here are strictly at your own risk. You accept full responsibility for any decisions or outcomes arising from your use of this website and agree to release us from any liability in connection with your use of, or reliance upon, the content or products found herein.