
|
China Bluechemical Ltd. (3983.HK) DCF -Bewertung |
Fully Editable: Tailor To Your Needs In Excel Or Sheets
Professional Design: Trusted, Industry-Standard Templates
Investor-Approved Valuation Models
MAC/PC Compatible, Fully Unlocked
No Expertise Is Needed; Easy To Follow
China BlueChemical Ltd. (3983.HK) Bundle
Optimieren Sie Ihre Zeit und verbessern Sie die Präzision mit unserem DCF -Taschenrechner (3983HK)! Mit realen Daten von China Bluechemical Ltd. und der Ermöglichung anpassbarer Annahmen ermöglichen dieses Tool Sie, wie ein erfahrener Investor prognostiziert, analysieren und bewerten (3983HK).
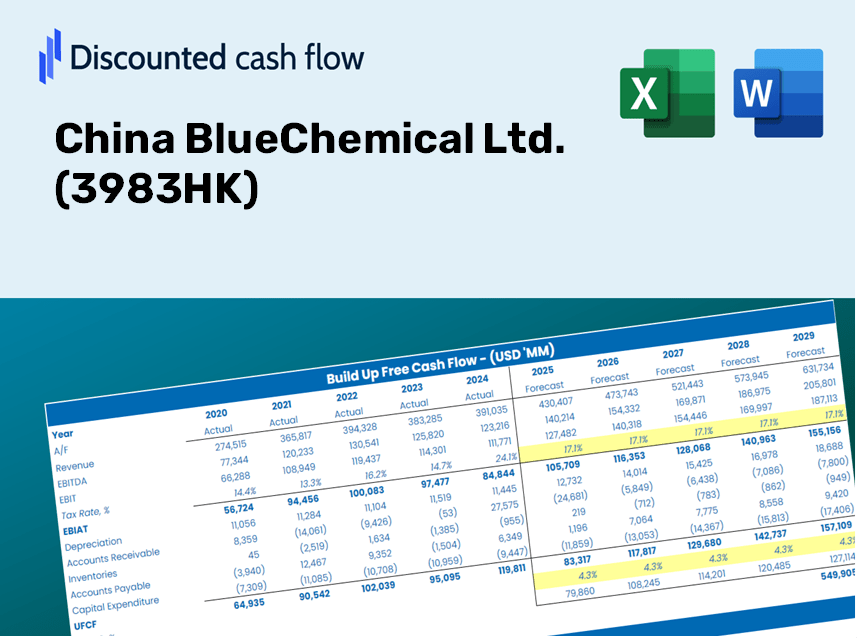
Discounted Cash Flow (DCF) - (USD MM)
| Year | AY1 2020 |
AY2 2021 |
AY3 2022 |
AY4 2023 |
AY5 2024 |
FY1 2025 |
FY2 2026 |
FY3 2027 |
FY4 2028 |
FY5 2029 |
|---|---|---|---|---|---|---|---|---|---|---|
| Revenue | 11,381.5 | 14,637.8 | 15,600.4 | 14,191.9 | 13,052.0 | 13,643.4 | 14,261.6 | 14,907.9 | 15,583.4 | 16,289.6 |
| Revenue Growth, % | 0 | 28.61 | 6.58 | -9.03 | -8.03 | 4.53 | 4.53 | 4.53 | 4.53 | 4.53 |
| EBITDA | 1,438.7 | 3,012.9 | 2,568.0 | 3,633.4 | 1,690.9 | 2,407.8 | 2,517.0 | 2,631.0 | 2,750.2 | 2,874.9 |
| EBITDA, % | 12.64 | 20.58 | 16.46 | 25.6 | 12.96 | 17.65 | 17.65 | 17.65 | 17.65 | 17.65 |
| Depreciation | 685.2 | 581.8 | 575.3 | 685.6 | 636.0 | 638.1 | 667.1 | 697.3 | 728.9 | 761.9 |
| Depreciation, % | 6.02 | 3.97 | 3.69 | 4.83 | 4.87 | 4.68 | 4.68 | 4.68 | 4.68 | 4.68 |
| EBIT | 753.5 | 2,431.1 | 1,992.7 | 2,947.9 | 1,054.9 | 1,769.7 | 1,849.9 | 1,933.7 | 2,021.4 | 2,113.0 |
| EBIT, % | 6.62 | 16.61 | 12.77 | 20.77 | 8.08 | 12.97 | 12.97 | 12.97 | 12.97 | 12.97 |
| Total Cash | 11,106.1 | 12,269.8 | 13,707.4 | 14,411.7 | 14,760.6 | 12,804.8 | 13,385.1 | 13,991.6 | 14,625.6 | 15,288.4 |
| Total Cash, percent | .0 | .0 | .0 | .0 | .0 | .0 | .0 | .0 | .0 | .0 |
| Account Receivables | 709.1 | 239.8 | 473.1 | 310.1 | 565.1 | 475.2 | 496.8 | 519.3 | 542.8 | 567.4 |
| Account Receivables, % | 6.23 | 1.64 | 3.03 | 2.19 | 4.33 | 3.48 | 3.48 | 3.48 | 3.48 | 3.48 |
| Inventories | 1,094.2 | 1,345.5 | 1,300.1 | 1,064.6 | 1,228.8 | 1,202.1 | 1,256.6 | 1,313.6 | 1,373.1 | 1,435.3 |
| Inventories, % | 9.61 | 9.19 | 8.33 | 7.5 | 9.41 | 8.81 | 8.81 | 8.81 | 8.81 | 8.81 |
| Accounts Payable | 808.9 | 1,458.9 | 1,471.1 | 1,243.7 | 1,166.8 | 1,206.3 | 1,260.9 | 1,318.1 | 1,377.8 | 1,440.2 |
| Accounts Payable, % | 7.11 | 9.97 | 9.43 | 8.76 | 8.94 | 8.84 | 8.84 | 8.84 | 8.84 | 8.84 |
| Capital Expenditure | -407.4 | -1,157.5 | -1,459.4 | -811.9 | -660.5 | -862.9 | -902.0 | -942.9 | -985.6 | -1,030.3 |
| Capital Expenditure, % | -3.58 | -7.91 | -9.35 | -5.72 | -5.06 | -6.32 | -6.32 | -6.32 | -6.32 | -6.32 |
| Tax Rate, % | 26.99 | 26.99 | 26.99 | 26.99 | 26.99 | 26.99 | 26.99 | 26.99 | 26.99 | 26.99 |
| EBITAT | 533.1 | 1,378.3 | 1,441.4 | 2,635.5 | 770.2 | 1,282.0 | 1,340.1 | 1,400.8 | 1,464.3 | 1,530.6 |
| Depreciation | ||||||||||
| Changes in Account Receivables | ||||||||||
| Changes in Inventories | ||||||||||
| Changes in Accounts Payable | ||||||||||
| Capital Expenditure | ||||||||||
| UFCF | -183.4 | 1,670.4 | 381.7 | 2,680.2 | 249.7 | 1,213.2 | 1,083.8 | 1,132.9 | 1,184.2 | 1,237.9 |
| WACC, % | 7.31 | 7.22 | 7.32 | 7.43 | 7.32 | 7.32 | 7.32 | 7.32 | 7.32 | 7.32 |
| PV UFCF | ||||||||||
| SUM PV UFCF | 4,750.3 | |||||||||
| Long Term Growth Rate, % | 0.50 | |||||||||
| Free cash flow (T + 1) | 1,244 | |||||||||
| Terminal Value | 18,244 | |||||||||
| Present Terminal Value | 12,815 | |||||||||
| Enterprise Value | 17,566 | |||||||||
| Net Debt | 1,572 | |||||||||
| Equity Value | 15,993 | |||||||||
| Diluted Shares Outstanding, MM | 4,610 | |||||||||
| Equity Value Per Share | 3.47 |
What You Will Receive
- Editable Forecast Inputs: Effortlessly adjust key assumptions (growth %, margins, WACC) to explore various scenarios.
- Real-World Data: China BlueChemical Ltd.’s financial data pre-populated to facilitate your analysis.
- Automatic DCF Outputs: The template computes Net Present Value (NPV) and intrinsic value for you.
- Customizable and Professional: A refined Excel model tailored to your valuation requirements.
- Designed for Analysts and Investors: Perfect for testing projections, validating strategies, and enhancing efficiency.
Key Features
- Real-Life 3983HK Data: Pre-filled with China BlueChemical Ltd.'s historical financials and forward-looking projections.
- Fully Customizable Inputs: Adjust revenue growth, profit margins, WACC, tax rates, and capital expenditures.
- Dynamic Valuation Model: Automatic updates to Net Present Value (NPV) and intrinsic value based on your inputs.
- Scenario Testing: Create various forecasting scenarios to analyze different valuation outcomes.
- User-Friendly Design: Intuitive, organized, and suitable for both professionals and beginners.
How It Works
- Step 1: Download the Excel file.
- Step 2: Review pre-entered China BlueChemical Ltd. (3983HK) data (historical and projected).
- Step 3: Adjust key assumptions (yellow cells) based on your analysis.
- Step 4: View automatic recalculations for China BlueChemical Ltd. (3983HK)’s intrinsic value.
- Step 5: Use the outputs for investment decisions or reporting.
Reasons to Use This Calculator for China BlueChemical Ltd. (3983HK)
- All-in-One Solution: Features DCF, WACC, and comprehensive financial ratio analyses in a single package.
- Flexible Input Options: Modify the yellow-highlighted fields to explore various scenarios.
- In-Depth Analysis: Automatically computes the intrinsic value and Net Present Value for China BlueChemical Ltd. (3983HK).
- Pre-Loaded Information: Historical and projected data provide a solid foundation for accurate analysis.
- High-Quality Output: Perfect for financial analysts, investors, and business consultants focusing on China BlueChemical Ltd. (3983HK).
Who Can Benefit from This Product?
- Investors: Accurately assess the fair value of China BlueChemical Ltd. (3983HK) prior to making investment choices.
- CFOs: Utilize a professional-grade DCF model for enhanced financial reporting and analysis.
- Consultants: Easily modify the template for crafting valuation reports for clients.
- Entrepreneurs: Acquire insights into the financial modeling practices of leading firms.
- Educators: Employ it as a teaching resource to illustrate various valuation methodologies.
Contents of the Template
- Comprehensive DCF Model: An editable template featuring detailed valuation calculations.
- Real-World Data: China BlueChemical Ltd. (3983HK)’s historical and projected financial information preloaded for analysis.
- Customizable Parameters: Modify WACC, growth rates, and tax assumptions to explore different scenarios.
- Financial Statements: Complete annual and quarterly breakdowns for enhanced insights.
- Key Ratios: Integrated analysis of profitability, efficiency, and leverage metrics.
- Dashboard with Visual Outputs: Charts and tables providing clear, actionable results.
Disclaimer
All information, articles, and product details provided on this website are for general informational and educational purposes only. We do not claim any ownership over, nor do we intend to infringe upon, any trademarks, copyrights, logos, brand names, or other intellectual property mentioned or depicted on this site. Such intellectual property remains the property of its respective owners, and any references here are made solely for identification or informational purposes, without implying any affiliation, endorsement, or partnership.
We make no representations or warranties, express or implied, regarding the accuracy, completeness, or suitability of any content or products presented. Nothing on this website should be construed as legal, tax, investment, financial, medical, or other professional advice. In addition, no part of this site—including articles or product references—constitutes a solicitation, recommendation, endorsement, advertisement, or offer to buy or sell any securities, franchises, or other financial instruments, particularly in jurisdictions where such activity would be unlawful.
All content is of a general nature and may not address the specific circumstances of any individual or entity. It is not a substitute for professional advice or services. Any actions you take based on the information provided here are strictly at your own risk. You accept full responsibility for any decisions or outcomes arising from your use of this website and agree to release us from any liability in connection with your use of, or reliance upon, the content or products found herein.