
|
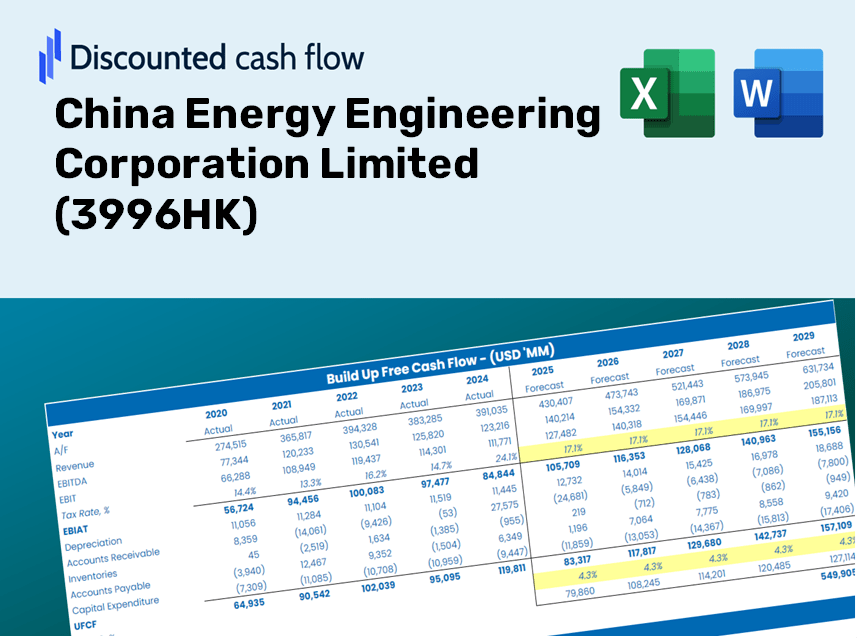
China Energy Engineering Corporation Limited (3996.HK) DCF -Bewertung |
Fully Editable: Tailor To Your Needs In Excel Or Sheets
Professional Design: Trusted, Industry-Standard Templates
Investor-Approved Valuation Models
MAC/PC Compatible, Fully Unlocked
No Expertise Is Needed; Easy To Follow
China Energy Engineering Corporation Limited (3996.HK) Bundle
Verbessern Sie Ihre Anlagestrategien mit dem DCF -Taschenrechner (3996HK)! Erforschen Sie authentische Finanzdaten von China Energy Engineering Corporation Limited, stellen Sie Wachstumsprojektionen und -kosten an und beobachten Sie sofort die Auswirkungen dieser Änderungen auf den inneren Wert von (3996HK).
Discounted Cash Flow (DCF) - (USD MM)
| Year | AY1 2020 |
AY2 2021 |
AY3 2022 |
AY4 2023 |
AY5 2024 |
FY1 2025 |
FY2 2026 |
FY3 2027 |
FY4 2028 |
FY5 2029 |
|---|---|---|---|---|---|---|---|---|---|---|
| Revenue | 296,217.0 | 353,187.1 | 401,482.9 | 444,917.7 | 478,536.9 | 539,887.3 | 609,103.2 | 687,192.8 | 775,293.8 | 874,689.7 |
| Revenue Growth, % | 0 | 19.23 | 13.67 | 10.82 | 7.56 | 12.82 | 12.82 | 12.82 | 12.82 | 12.82 |
| EBITDA | 20,228.2 | 23,091.5 | 27,470.1 | 29,463.0 | 29,754.6 | 35,685.5 | 40,260.5 | 45,422.1 | 51,245.4 | 57,815.2 |
| EBITDA, % | 6.83 | 6.54 | 6.84 | 6.62 | 6.22 | 6.61 | 6.61 | 6.61 | 6.61 | 6.61 |
| Depreciation | 3,843.8 | 5,106.7 | 6,327.2 | 7,645.6 | 8,534.0 | 8,445.2 | 9,527.9 | 10,749.4 | 12,127.5 | 13,682.4 |
| Depreciation, % | 1.3 | 1.45 | 1.58 | 1.72 | 1.78 | 1.56 | 1.56 | 1.56 | 1.56 | 1.56 |
| EBIT | 16,384.4 | 17,984.8 | 21,143.0 | 21,817.4 | 21,220.6 | 27,240.3 | 30,732.6 | 34,672.6 | 39,117.8 | 44,132.9 |
| EBIT, % | 5.53 | 5.09 | 5.27 | 4.9 | 4.43 | 5.05 | 5.05 | 5.05 | 5.05 | 5.05 |
| Total Cash | 58,685.2 | 67,379.5 | 85,893.2 | 85,152.5 | 100,354.1 | 108,401.9 | 122,299.5 | 137,978.8 | 155,668.3 | 175,625.6 |
| Total Cash, percent | .0 | .0 | .0 | .0 | .0 | .0 | .0 | .0 | .0 | .0 |
| Account Receivables | 123,332.4 | 165,643.7 | 215,662.1 | 252,834.0 | 255,027.4 | 272,505.1 | 307,441.4 | 346,856.7 | 391,325.2 | 441,494.7 |
| Account Receivables, % | 41.64 | 46.9 | 53.72 | 56.83 | 53.29 | 50.47 | 50.47 | 50.47 | 50.47 | 50.47 |
| Inventories | 67,422.0 | 64,222.4 | 67,259.7 | 74,466.1 | 82,048.1 | 98,885.9 | 111,563.5 | 125,866.5 | 142,003.1 | 160,208.5 |
| Inventories, % | 22.76 | 18.18 | 16.75 | 16.74 | 17.15 | 18.32 | 18.32 | 18.32 | 18.32 | 18.32 |
| Accounts Payable | 121,425.0 | 2,843.0 | 13,871.2 | 71,432.3 | 73,929.6 | 82,879.3 | 93,504.8 | 105,492.5 | 119,017.1 | 134,275.6 |
| Accounts Payable, % | 40.99 | 0.80495 | 3.46 | 16.06 | 15.45 | 15.35 | 15.35 | 15.35 | 15.35 | 15.35 |
| Capital Expenditure | -16,391.8 | -15,387.9 | -21,896.5 | -34,110.9 | -49,877.6 | -36,101.4 | -40,729.8 | -45,951.5 | -51,842.7 | -58,489.1 |
| Capital Expenditure, % | -5.53 | -4.36 | -5.45 | -7.67 | -10.42 | -6.69 | -6.69 | -6.69 | -6.69 | -6.69 |
| Tax Rate, % | 44.5 | 44.5 | 44.5 | 44.5 | 44.5 | 44.5 | 44.5 | 44.5 | 44.5 | 44.5 |
| EBITAT | 6,355.7 | 8,963.4 | 12,096.9 | 12,436.0 | 11,777.7 | 14,074.9 | 15,879.3 | 17,915.1 | 20,211.9 | 22,803.2 |
| Depreciation | ||||||||||
| Changes in Account Receivables | ||||||||||
| Changes in Inventories | ||||||||||
| Changes in Accounts Payable | ||||||||||
| Capital Expenditure | ||||||||||
| UFCF | -75,521.7 | -159,011.6 | -45,499.8 | -846.5 | -36,843.9 | -38,947.2 | -52,311.0 | -59,017.4 | -66,583.7 | -75,120.0 |
| WACC, % | 2.08 | 2.44 | 2.67 | 2.67 | 2.62 | 2.49 | 2.49 | 2.49 | 2.49 | 2.49 |
| PV UFCF | ||||||||||
| SUM PV UFCF | -269,358.6 | |||||||||
| Long Term Growth Rate, % | 0.50 | |||||||||
| Free cash flow (T + 1) | -75,496 | |||||||||
| Terminal Value | -3,786,021 | |||||||||
| Present Terminal Value | -3,347,261 | |||||||||
| Enterprise Value | -3,616,619 | |||||||||
| Net Debt | 218,249 | |||||||||
| Equity Value | -3,834,868 | |||||||||
| Diluted Shares Outstanding, MM | 44,190 | |||||||||
| Equity Value Per Share | -86.78 |
Benefits You Will Receive
- Authentic 3996HK Financial Data: Pre-populated with China Energy Engineering Corporation’s historical and projected figures for accurate assessment.
- Completely Customizable Template: Easily adjust critical inputs such as revenue growth, WACC, and EBITDA %.
- Instant Calculations: Watch the intrinsic value of 3996HK update in real-time as you make adjustments.
- Professional Valuation Tool: Tailored for investors, analysts, and consultants aiming for precise DCF analysis.
- Intuitive Design: Clear layout and straightforward instructions suitable for users of all experience levels.
Key Features
- 🔍 Real-Life 3996HK Financials: Pre-filled historical and projected data for China Energy Engineering Corporation Limited.
- ✏️ Fully Customizable Inputs: Modify all essential parameters (yellow cells) such as WACC, growth %, and tax rates.
- 📊 Professional DCF Valuation: Integrated formulas calculate the intrinsic value of 3996HK using the Discounted Cash Flow method.
- ⚡ Instant Results: Visualize the valuation of 3996HK immediately after adjustments.
- Scenario Analysis: Assess and compare results for different financial assumptions side-by-side.
How It Functions
- Step 1: Download the ready-to-use Excel template featuring China Energy Engineering Corporation Limited’s data.
- Step 2: Review the pre-filled tabs and familiarize yourself with the essential metrics.
- Step 3: Modify forecasts and assumptions in the editable yellow cells (WACC, growth, margins).
- Step 4: Instantly see recalibrated results, including the intrinsic value of China Energy Engineering Corporation Limited (3996HK).
- Step 5: Make informed investment choices or create reports based on the generated outputs.
Why Opt for This Calculator?
- Precision: Leverages authentic China Energy Engineering financials for reliable data.
- Versatility: Built to allow users to experiment and adjust inputs with ease.
- Efficiency: Eliminate the complexity of constructing a DCF model from the ground up.
- Expert-Level: Crafted with the accuracy and functionality expected by CFOs.
- Intuitive: Simple enough for anyone, even those new to financial modeling.
Who Should Utilize This Offering?
- Individual Investors: Gain insights for making informed decisions about buying or selling shares of China Energy Engineering Corporation Limited (3996HK).
- Financial Analysts: Enhance valuation methodologies with comprehensive financial models tailored for the energy sector.
- Consultants: Provide clients with timely and accurate valuation analyses related to China Energy Engineering Corporation Limited (3996HK).
- Business Owners: Learn from the valuation strategies of major energy firms like China Energy Engineering Corporation Limited (3996HK) to inform your own business tactics.
- Finance Students: Explore valuation principles using real-time data and case studies from China Energy Engineering Corporation Limited (3996HK).
What the Template Includes
- Comprehensive DCF Model: Editable template featuring extensive valuation calculations.
- Real-World Data: China Energy Engineering Corporation Limited’s (3996HK) historical and projected financials preloaded for in-depth analysis.
- Customizable Parameters: Modify WACC, growth rates, and tax assumptions to explore various scenarios.
- Financial Statements: Complete annual and quarterly breakdowns for enhanced insights.
- Key Ratios: Integrated analysis covering profitability, efficiency, and leverage metrics.
- Dashboard with Visual Outputs: Charts and tables designed to present clear, actionable results.
Disclaimer
All information, articles, and product details provided on this website are for general informational and educational purposes only. We do not claim any ownership over, nor do we intend to infringe upon, any trademarks, copyrights, logos, brand names, or other intellectual property mentioned or depicted on this site. Such intellectual property remains the property of its respective owners, and any references here are made solely for identification or informational purposes, without implying any affiliation, endorsement, or partnership.
We make no representations or warranties, express or implied, regarding the accuracy, completeness, or suitability of any content or products presented. Nothing on this website should be construed as legal, tax, investment, financial, medical, or other professional advice. In addition, no part of this site—including articles or product references—constitutes a solicitation, recommendation, endorsement, advertisement, or offer to buy or sell any securities, franchises, or other financial instruments, particularly in jurisdictions where such activity would be unlawful.
All content is of a general nature and may not address the specific circumstances of any individual or entity. It is not a substitute for professional advice or services. Any actions you take based on the information provided here are strictly at your own risk. You accept full responsibility for any decisions or outcomes arising from your use of this website and agree to release us from any liability in connection with your use of, or reliance upon, the content or products found herein.