
|
3M India Limited (3Mindia.NS) DCF -Bewertung |
Fully Editable: Tailor To Your Needs In Excel Or Sheets
Professional Design: Trusted, Industry-Standard Templates
Investor-Approved Valuation Models
MAC/PC Compatible, Fully Unlocked
No Expertise Is Needed; Easy To Follow
3M India Limited (3MINDIA.NS) Bundle
Bewerten Sie die finanziellen Aussichten von 3M India Limited wie ein Fachmann! Dieser (3Mindianer) DCF-Taschenrechner bietet Ihnen vorgefüllte Finanzdaten und umfassende Flexibilität, um das Umsatzwachstum, die WACC, die Margen und andere wesentliche Annahmen zu ändern, um sich mit Ihren Vorhersagen auszurichten.
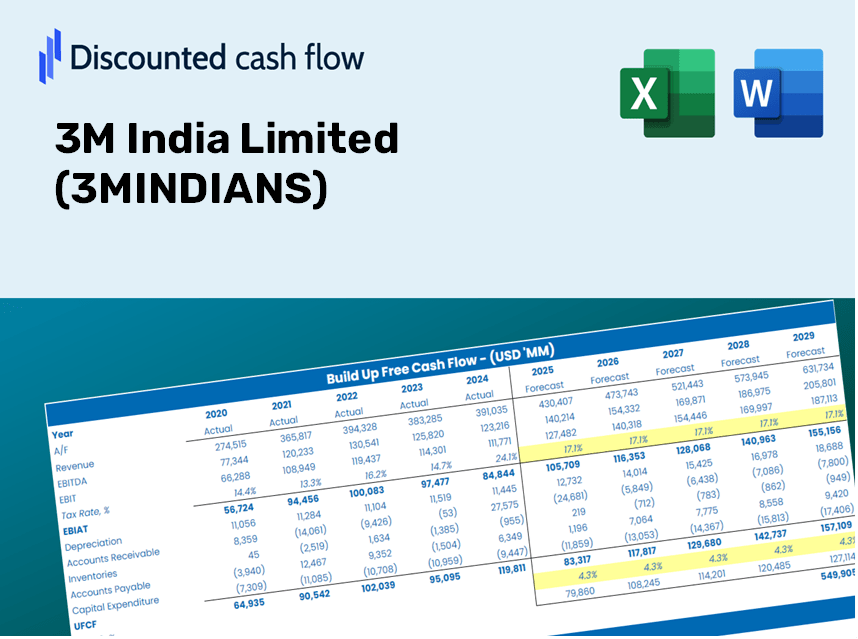
Discounted Cash Flow (DCF) - (USD MM)
| Year | AY1 2021 |
AY2 2022 |
AY3 2023 |
AY4 2024 |
AY5 2025 |
FY1 2026 |
FY2 2027 |
FY3 2028 |
FY4 2029 |
FY5 2030 |
|---|---|---|---|---|---|---|---|---|---|---|
| Revenue | 26,030.9 | 33,339.4 | 39,593.7 | 41,893.6 | 44,455.6 | 50,986.1 | 58,475.9 | 67,066.0 | 76,917.9 | 88,217.2 |
| Revenue Growth, % | 0 | 28.08 | 18.76 | 5.81 | 6.12 | 14.69 | 14.69 | 14.69 | 14.69 | 14.69 |
| EBITDA | 2,842.2 | 4,248.7 | 6,723.9 | 8,373.7 | 8,398.7 | 8,109.3 | 9,300.6 | 10,666.8 | 12,233.8 | 14,030.9 |
| EBITDA, % | 10.92 | 12.74 | 16.98 | 19.99 | 18.89 | 15.9 | 15.9 | 15.9 | 15.9 | 15.9 |
| Depreciation | 618.5 | 551.2 | 576.8 | 529.4 | 552.9 | 815.1 | 934.8 | 1,072.1 | 1,229.6 | 1,410.3 |
| Depreciation, % | 2.38 | 1.65 | 1.46 | 1.26 | 1.24 | 1.6 | 1.6 | 1.6 | 1.6 | 1.6 |
| EBIT | 2,223.8 | 3,697.6 | 6,147.1 | 7,844.3 | 7,845.8 | 7,294.3 | 8,365.8 | 9,594.7 | 11,004.2 | 12,620.7 |
| EBIT, % | 8.54 | 11.09 | 15.53 | 18.72 | 17.65 | 14.31 | 14.31 | 14.31 | 14.31 | 14.31 |
| Total Cash | 10,624.2 | 13,278.6 | 8,106.0 | 13,553.5 | 9,373.8 | 15,760.2 | 18,075.3 | 20,730.6 | 23,775.9 | 27,268.6 |
| Total Cash, percent | .0 | .0 | .0 | .0 | .0 | .0 | .0 | .0 | .0 | .0 |
| Account Receivables | 5,247.1 | 5,529.1 | 6,350.4 | 7,080.0 | 7,906.0 | 8,918.9 | 10,229.1 | 11,731.7 | 13,455.1 | 15,431.7 |
| Account Receivables, % | 20.16 | 16.58 | 16.04 | 16.9 | 17.78 | 17.49 | 17.49 | 17.49 | 17.49 | 17.49 |
| Inventories | 4,655.5 | 4,995.8 | 6,107.4 | 5,370.2 | 6,482.4 | 7,718.7 | 8,852.6 | 10,153.1 | 11,644.6 | 13,355.1 |
| Inventories, % | 17.88 | 14.98 | 15.43 | 12.82 | 14.58 | 15.14 | 15.14 | 15.14 | 15.14 | 15.14 |
| Accounts Payable | 5,003.8 | 5,384.4 | 7,644.4 | 8,239.2 | 7,560.0 | 9,315.5 | 10,683.9 | 12,253.4 | 14,053.4 | 16,117.8 |
| Accounts Payable, % | 19.22 | 16.15 | 19.31 | 19.67 | 17.01 | 18.27 | 18.27 | 18.27 | 18.27 | 18.27 |
| Capital Expenditure | -415.2 | -703.1 | -602.2 | -314.1 | -554.2 | -736.4 | -844.5 | -968.6 | -1,110.9 | -1,274.1 |
| Capital Expenditure, % | -1.59 | -2.11 | -1.52 | -0.74986 | -1.25 | -1.44 | -1.44 | -1.44 | -1.44 | -1.44 |
| Tax Rate, % | 38.45 | 38.45 | 38.45 | 38.45 | 38.45 | 38.45 | 38.45 | 38.45 | 38.45 | 38.45 |
| EBITAT | 1,641.9 | 2,736.3 | 4,564.2 | 5,858.2 | 4,829.5 | 5,227.4 | 5,995.3 | 6,876.0 | 7,886.0 | 9,044.5 |
| Depreciation | ||||||||||
| Changes in Account Receivables | ||||||||||
| Changes in Inventories | ||||||||||
| Changes in Accounts Payable | ||||||||||
| Capital Expenditure | ||||||||||
| UFCF | -3,053.6 | 2,342.7 | 4,865.8 | 6,675.8 | 2,210.7 | 4,812.2 | 5,009.9 | 5,745.9 | 6,589.9 | 7,558.0 |
| WACC, % | 4.69 | 4.69 | 4.69 | 4.69 | 4.69 | 4.69 | 4.69 | 4.69 | 4.69 | 4.69 |
| PV UFCF | ||||||||||
| SUM PV UFCF | 25,669.9 | |||||||||
| Long Term Growth Rate, % | 4.00 | |||||||||
| Free cash flow (T + 1) | 7,860 | |||||||||
| Terminal Value | 1,135,551 | |||||||||
| Present Terminal Value | 902,890 | |||||||||
| Enterprise Value | 928,560 | |||||||||
| Net Debt | -8,378 | |||||||||
| Equity Value | 936,939 | |||||||||
| Diluted Shares Outstanding, MM | 11 | |||||||||
| Equity Value Per Share | 83,171.98 |
What You Will Receive
- Pre-Loaded Financial Model: Leverage 3M India Limited’s actual data for accurate DCF valuation.
- Comprehensive Forecast Control: Modify revenue growth, profit margins, WACC, and other essential factors.
- Real-Time Calculations: Automatic updates provide immediate insights as you make adjustments.
- Professional-Grade Template: A polished Excel file crafted for high-quality valuation.
- Flexible and Reusable: Designed for customization, allowing ongoing use for extensive forecasting.
Key Features
- 🔍 Real-Life 3M India Financials: Pre-filled historical and projected data for 3M India Limited (3MINDIANS).
- ✏️ Fully Customizable Inputs: Modify essential parameters (yellow cells) such as WACC, growth %, and tax rates.
- 📊 Professional DCF Valuation: Integrated formulas determine the intrinsic value of 3M India using the Discounted Cash Flow method.
- ⚡ Instant Results: Visualize 3M India's valuation immediately after input adjustments.
- Scenario Analysis: Evaluate and compare results for different financial assumptions side-by-side.
How It Works
- Step 1: Download the prebuilt Excel template featuring 3M India Limited's ([3MINDIANS]) data.
- Step 2: Navigate through the pre-filled sheets to familiarize yourself with the key metrics.
- Step 3: Modify forecasts and assumptions within the editable yellow cells (WACC, growth, margins).
- Step 4: Instantly see recalibrated results, including the intrinsic value of 3M India Limited ([3MINDIANS]).
- Step 5: Make informed investment choices or create reports based on the results.
Why Choose the 3M India Limited (3MINDIANS) Calculator?
- Precision: Utilizes authentic 3M financial data to ensure precise calculations.
- Customizable: Tailored for users to easily test and alter inputs as needed.
- Efficient: Avoid the complexities of creating a DCF model from the ground up.
- High-Quality: Crafted with the expertise and accuracy expected at the CFO level.
- Intuitive: Simple to navigate, even for those without extensive financial modeling skills.
Who Can Benefit from This Product?
- Professional Investors: Create comprehensive and precise valuation models for investment analysis of 3M India Limited (3MINDIANS).
- Corporate Finance Teams: Evaluate valuation scenarios to inform strategic decision-making within the organization.
- Consultants and Advisors: Equip clients with trustworthy valuation insights for 3M India Limited (3MINDIANS) stock.
- Students and Educators: Leverage real-world data for practicing and teaching financial modeling techniques.
- Business Enthusiasts: Gain insights into the market valuation of innovative companies like 3M India Limited (3MINDIANS).
Contents of the Template
- Pre-Filled DCF Model: 3M India Limited’s (3MINDIANS) financial data ready for immediate application.
- WACC Calculator: Comprehensive calculations for Weighted Average Cost of Capital.
- Financial Ratios: Assess 3M India's profitability, leverage, and efficiency metrics.
- Editable Inputs: Update assumptions such as growth rates, margins, and CAPEX to align with your scenarios.
- Financial Statements: Access annual and quarterly reports for thorough analysis.
- Interactive Dashboard: Effortlessly visualize essential valuation metrics and outcomes.
Disclaimer
All information, articles, and product details provided on this website are for general informational and educational purposes only. We do not claim any ownership over, nor do we intend to infringe upon, any trademarks, copyrights, logos, brand names, or other intellectual property mentioned or depicted on this site. Such intellectual property remains the property of its respective owners, and any references here are made solely for identification or informational purposes, without implying any affiliation, endorsement, or partnership.
We make no representations or warranties, express or implied, regarding the accuracy, completeness, or suitability of any content or products presented. Nothing on this website should be construed as legal, tax, investment, financial, medical, or other professional advice. In addition, no part of this site—including articles or product references—constitutes a solicitation, recommendation, endorsement, advertisement, or offer to buy or sell any securities, franchises, or other financial instruments, particularly in jurisdictions where such activity would be unlawful.
All content is of a general nature and may not address the specific circumstances of any individual or entity. It is not a substitute for professional advice or services. Any actions you take based on the information provided here are strictly at your own risk. You accept full responsibility for any decisions or outcomes arising from your use of this website and agree to release us from any liability in connection with your use of, or reliance upon, the content or products found herein.