
|
Showa Denko K.K. (4004.t) DCF -Bewertung |
Fully Editable: Tailor To Your Needs In Excel Or Sheets
Professional Design: Trusted, Industry-Standard Templates
Investor-Approved Valuation Models
MAC/PC Compatible, Fully Unlocked
No Expertise Is Needed; Easy To Follow
Showa Denko K.K. (4004.T) Bundle
Unser (4004T) DCF -Taschenrechner entwickelt für Genauigkeit und ermöglicht es Ihnen, Showa Denko K.K. Bewertung unter Verwendung realer Finanzdaten und bietet vollständige Flexibilität, um alle Schlüsselparameter für verbesserte Projektionen zu ändern.
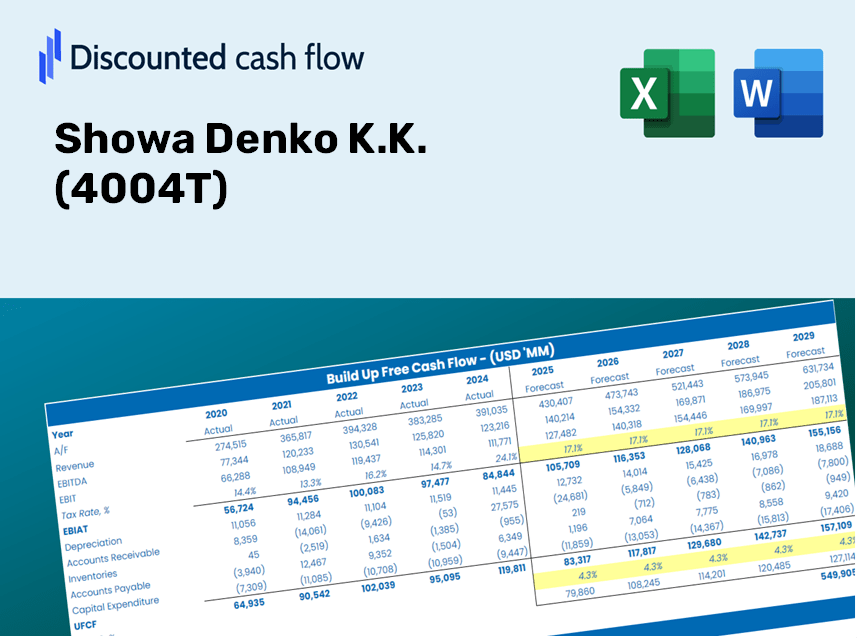
Discounted Cash Flow (DCF) - (USD MM)
| Year | AY1 2020 |
AY2 2021 |
AY3 2022 |
AY4 2023 |
AY5 2024 |
FY1 2025 |
FY2 2026 |
FY3 2027 |
FY4 2028 |
FY5 2029 |
|---|---|---|---|---|---|---|---|---|---|---|
| Revenue | 973,700.0 | 1,419,635.0 | 1,392,621.0 | 1,288,869.0 | 1,389,277.0 | 1,542,915.0 | 1,713,543.5 | 1,903,041.6 | 2,113,496.0 | 2,347,224.3 |
| Revenue Growth, % | 0 | 45.8 | -1.9 | -7.45 | 7.79 | 11.06 | 11.06 | 11.06 | 11.06 | 11.06 |
| EBITDA | 33,163.0 | 148,378.0 | 175,495.0 | 96,656.0 | 198,615.0 | 148,906.9 | 165,374.3 | 183,662.8 | 203,973.8 | 226,530.9 |
| EBITDA, % | 3.41 | 10.45 | 12.6 | 7.5 | 14.3 | 9.65 | 9.65 | 9.65 | 9.65 | 9.65 |
| Depreciation | 78,362.0 | 115,446.0 | 108,807.0 | 109,469.0 | 98,026.0 | 122,021.0 | 135,515.2 | 150,501.6 | 167,145.3 | 185,629.6 |
| Depreciation, % | 8.05 | 8.13 | 7.81 | 8.49 | 7.06 | 7.91 | 7.91 | 7.91 | 7.91 | 7.91 |
| EBIT | -45,199.0 | 32,932.0 | 66,688.0 | -12,813.0 | 100,589.0 | 26,885.9 | 29,859.2 | 33,161.2 | 36,828.5 | 40,901.3 |
| EBIT, % | -4.64 | 2.32 | 4.79 | -0.99413 | 7.24 | 1.74 | 1.74 | 1.74 | 1.74 | 1.74 |
| Total Cash | 198,982.0 | 236,237.0 | 187,126.0 | 190,318.0 | 295,757.0 | 267,134.6 | 296,676.6 | 329,485.6 | 365,922.9 | 406,389.7 |
| Total Cash, percent | .0 | .0 | .0 | .0 | .0 | .0 | .0 | .0 | .0 | .0 |
| Account Receivables | 270,536.0 | 277,215.0 | 264,212.0 | 264,391.0 | 274,485.0 | 328,809.4 | 365,172.0 | 405,555.8 | 450,405.5 | 500,215.2 |
| Account Receivables, % | 27.78 | 19.53 | 18.97 | 20.51 | 19.76 | 21.31 | 21.31 | 21.31 | 21.31 | 21.31 |
| Inventories | 190,207.0 | 203,878.0 | 250,854.0 | 224,571.0 | 220,812.0 | 262,995.2 | 292,079.5 | 324,380.1 | 360,252.8 | 400,092.5 |
| Inventories, % | 19.53 | 14.36 | 18.01 | 17.42 | 15.89 | 17.05 | 17.05 | 17.05 | 17.05 | 17.05 |
| Accounts Payable | 164,356.0 | 207,745.0 | 195,356.0 | 177,375.0 | 171,433.0 | 221,078.0 | 245,526.6 | 272,679.0 | 302,834.2 | 336,324.2 |
| Accounts Payable, % | 16.88 | 14.63 | 14.03 | 13.76 | 12.34 | 14.33 | 14.33 | 14.33 | 14.33 | 14.33 |
| Capital Expenditure | -64,500.0 | -67,741.0 | -87,857.0 | -87,105.0 | -88,312.0 | -95,104.1 | -105,621.5 | -117,302.1 | -130,274.3 | -144,681.1 |
| Capital Expenditure, % | -6.62 | -4.77 | -6.31 | -6.76 | -6.36 | -6.16 | -6.16 | -6.16 | -6.16 | -6.16 |
| Tax Rate, % | 13.17 | 13.17 | 13.17 | 13.17 | 13.17 | 13.17 | 13.17 | 13.17 | 13.17 | 13.17 |
| EBITAT | -50,525.4 | -17,372.4 | 42,456.0 | -3,183.2 | 87,346.2 | 14,805.6 | 16,442.9 | 18,261.3 | 20,280.8 | 22,523.7 |
| Depreciation | ||||||||||
| Changes in Account Receivables | ||||||||||
| Changes in Inventories | ||||||||||
| Changes in Accounts Payable | ||||||||||
| Capital Expenditure | ||||||||||
| UFCF | -333,050.4 | 53,371.6 | 17,044.0 | 27,303.8 | 84,783.2 | -5,140.2 | 5,338.5 | 5,928.9 | 6,584.5 | 7,312.7 |
| WACC, % | 4.91 | 3.13 | 4.26 | 3.57 | 4.67 | 4.11 | 4.11 | 4.11 | 4.11 | 4.11 |
| PV UFCF | ||||||||||
| SUM PV UFCF | 16,827.1 | |||||||||
| Long Term Growth Rate, % | 2.00 | |||||||||
| Free cash flow (T + 1) | 7,459 | |||||||||
| Terminal Value | 353,853 | |||||||||
| Present Terminal Value | 289,337 | |||||||||
| Enterprise Value | 306,164 | |||||||||
| Net Debt | 729,050 | |||||||||
| Equity Value | -422,886 | |||||||||
| Diluted Shares Outstanding, MM | 181 | |||||||||
| Equity Value Per Share | -2,339.36 |
What You Will Receive
- Pre-Filled Financial Model: Utilizing Showa Denko K.K.'s actual data for accurate DCF valuation.
- Comprehensive Forecast Control: Modify revenue growth, margins, WACC, and other essential factors.
- Real-Time Calculations: Automatic updates enable you to view results instantly as you make adjustments.
- Investor-Ready Template: A polished Excel file crafted for high-quality valuation.
- Customizable and Reusable: Designed with flexibility in mind, suitable for repeated use in detailed forecasting.
Key Features
- Pre-Loaded Data: Showa Denko K.K.’s historical financial reports and pre-filled projections.
- Fully Customizable Inputs: Modify WACC, tax rates, revenue growth, and EBITDA margins as needed.
- Real-Time Results: View Showa Denko K.K.’s intrinsic value recalculated instantly.
- Clear Visual Outputs: Dashboard graphs showcase valuation outcomes and essential metrics.
- Designed for Precision: A professional-grade tool for analysts, investors, and finance specialists.
How It Works
- Download: Obtain the pre-prepared Excel file containing Showa Denko K.K.'s (4004T) financial data.
- Customize: Modify forecasts such as revenue growth, EBITDA %, and WACC according to your analysis.
- Update Automatically: The intrinsic value and NPV calculations refresh in real-time.
- Test Scenarios: Develop various projections and instantly compare the results.
- Make Decisions: Leverage the valuation findings to inform your investment choices.
Why Opt for This Calculator for Showa Denko K.K. (4004T)?
- Designed for Experts: A sophisticated tool embraced by analysts, CFOs, and consultants.
- Accurate Data: Showa Denko's historical and projected financial data preloaded for precision.
- Flexible Scenario Analysis: Effortlessly simulate various forecasts and assumptions.
- Comprehensive Results: Automatically calculates intrinsic value, NPV, and other essential metrics.
- User-Friendly: Step-by-step guidance ensures a seamless experience.
Who Should Use This Product?
- Professional Investors: Develop comprehensive and trustworthy valuation models for analyzing portfolios that include Showa Denko K.K. (4004T).
- Corporate Finance Teams: Evaluate valuation scenarios to shape and inform internal strategic decisions for Showa Denko K.K. (4004T).
- Consultants and Advisors: Deliver precise valuation insights to clients focusing on Showa Denko K.K. (4004T).
- Students and Educators: Utilize real-world data to enhance practice and instruction in financial modeling relevant to Showa Denko K.K. (4004T).
- Tech Enthusiasts: Gain insights into the valuation of technology companies like Showa Denko K.K. (4004T) in the marketplace.
Contents of the Template
- Pre-Filled Data: Contains Showa Denko K.K.’s historical financial performance and projections.
- Discounted Cash Flow Model: An editable DCF valuation model with automatic calculations for your convenience.
- Weighted Average Cost of Capital (WACC): A separate sheet dedicated to calculating WACC using your custom inputs.
- Key Financial Ratios: Assess Showa Denko K.K.’s profitability, efficiency, and leverage.
- Customizable Inputs: Easily modify revenue growth, profit margins, and tax rates.
- Clear Dashboard: Visual representations, including charts and tables, summarizing essential valuation results.
Disclaimer
All information, articles, and product details provided on this website are for general informational and educational purposes only. We do not claim any ownership over, nor do we intend to infringe upon, any trademarks, copyrights, logos, brand names, or other intellectual property mentioned or depicted on this site. Such intellectual property remains the property of its respective owners, and any references here are made solely for identification or informational purposes, without implying any affiliation, endorsement, or partnership.
We make no representations or warranties, express or implied, regarding the accuracy, completeness, or suitability of any content or products presented. Nothing on this website should be construed as legal, tax, investment, financial, medical, or other professional advice. In addition, no part of this site—including articles or product references—constitutes a solicitation, recommendation, endorsement, advertisement, or offer to buy or sell any securities, franchises, or other financial instruments, particularly in jurisdictions where such activity would be unlawful.
All content is of a general nature and may not address the specific circumstances of any individual or entity. It is not a substitute for professional advice or services. Any actions you take based on the information provided here are strictly at your own risk. You accept full responsibility for any decisions or outcomes arising from your use of this website and agree to release us from any liability in connection with your use of, or reliance upon, the content or products found herein.