
|
Tokuyama Corporation (4043.T) DCF -Bewertung |
Fully Editable: Tailor To Your Needs In Excel Or Sheets
Professional Design: Trusted, Industry-Standard Templates
Investor-Approved Valuation Models
MAC/PC Compatible, Fully Unlocked
No Expertise Is Needed; Easy To Follow
Tokuyama Corporation (4043.T) Bundle
Bewerten Sie die finanziellen Aussichten der Tokuyama Corporation mit fachkundiger Präzision! Dieser (4043T) DCF-Taschenrechner bietet vorgefüllte Finanzdaten und ermöglicht Ihnen die volle Kontrolle, das Umsatzwachstum, WACC, Margen und andere wichtige Annahmen zu ändern, um sich an Ihren Prognosen auszurichten.
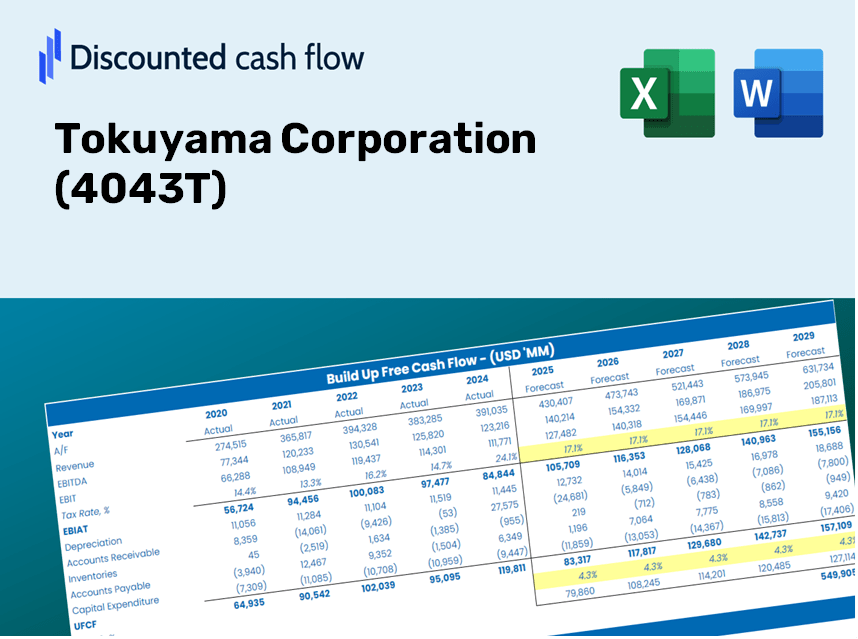
Discounted Cash Flow (DCF) - (USD MM)
| Year | AY1 2021 |
AY2 2022 |
AY3 2023 |
AY4 2024 |
AY5 2025 |
FY1 2026 |
FY2 2027 |
FY3 2028 |
FY4 2029 |
FY5 2030 |
|---|---|---|---|---|---|---|---|---|---|---|
| Revenue | 302,407.0 | 293,830.0 | 351,790.0 | 341,990.0 | 343,073.0 | 355,441.1 | 368,255.1 | 381,531.0 | 395,285.6 | 409,536.0 |
| Revenue Growth, % | 0 | -2.84 | 19.73 | -2.79 | 0.31668 | 3.61 | 3.61 | 3.61 | 3.61 | 3.61 |
| EBITDA | 49,486.0 | 48,747.0 | 36,789.0 | 44,879.0 | 51,915.0 | 50,946.9 | 52,783.6 | 54,686.5 | 56,658.0 | 58,700.6 |
| EBITDA, % | 16.36 | 16.59 | 10.46 | 13.12 | 15.13 | 14.33 | 14.33 | 14.33 | 14.33 | 14.33 |
| Depreciation | 17,003.0 | 19,716.0 | 20,773.0 | 17,690.0 | 19,688.0 | 20,721.4 | 21,468.5 | 22,242.4 | 23,044.3 | 23,875.0 |
| Depreciation, % | 5.62 | 6.71 | 5.9 | 5.17 | 5.74 | 5.83 | 5.83 | 5.83 | 5.83 | 5.83 |
| EBIT | 32,483.0 | 29,031.0 | 16,016.0 | 27,189.0 | 32,227.0 | 30,225.5 | 31,315.1 | 32,444.1 | 33,613.7 | 34,825.5 |
| EBIT, % | 10.74 | 9.88 | 4.55 | 7.95 | 9.39 | 8.5 | 8.5 | 8.5 | 8.5 | 8.5 |
| Total Cash | 83,681.0 | 83,116.0 | 68,080.0 | 48,684.0 | 75,544.0 | 79,310.6 | 82,169.9 | 85,132.2 | 88,201.3 | 91,381.0 |
| Total Cash, percent | .0 | .0 | .0 | .0 | .0 | .0 | .0 | .0 | .0 | .0 |
| Account Receivables | 70,811.0 | 78,140.0 | 92,000.0 | 87,041.0 | 78,116.0 | 88,421.1 | 91,608.8 | 94,911.3 | 98,333.0 | 101,878.0 |
| Account Receivables, % | 23.42 | 26.59 | 26.15 | 25.45 | 22.77 | 24.88 | 24.88 | 24.88 | 24.88 | 24.88 |
| Inventories | 39,599.0 | 55,723.0 | 81,323.0 | 71,888.0 | 69,652.0 | 68,599.3 | 71,072.3 | 73,634.5 | 76,289.1 | 79,039.4 |
| Inventories, % | 13.09 | 18.96 | 23.12 | 21.02 | 20.3 | 19.3 | 19.3 | 19.3 | 19.3 | 19.3 |
| Accounts Payable | 39,547.0 | 49,055.0 | 49,822.0 | 48,093.0 | 45,742.0 | 50,707.6 | 52,535.7 | 54,429.7 | 56,391.9 | 58,424.9 |
| Accounts Payable, % | 13.08 | 16.7 | 14.16 | 14.06 | 13.33 | 14.27 | 14.27 | 14.27 | 14.27 | 14.27 |
| Capital Expenditure | -23,800.0 | -31,887.0 | -31,916.0 | -31,591.0 | -22,598.0 | -31,008.1 | -32,126.0 | -33,284.1 | -34,484.1 | -35,727.2 |
| Capital Expenditure, % | -7.87 | -10.85 | -9.07 | -9.24 | -6.59 | -8.72 | -8.72 | -8.72 | -8.72 | -8.72 |
| Tax Rate, % | 25.31 | 25.31 | 25.31 | 25.31 | 25.31 | 25.31 | 25.31 | 25.31 | 25.31 | 25.31 |
| EBITAT | 25,741.7 | 29,399.5 | 10,397.5 | 18,666.1 | 24,069.1 | 23,425.1 | 24,269.6 | 25,144.5 | 26,051.0 | 26,990.2 |
| Depreciation | ||||||||||
| Changes in Account Receivables | ||||||||||
| Changes in Inventories | ||||||||||
| Changes in Accounts Payable | ||||||||||
| Capital Expenditure | ||||||||||
| UFCF | -51,918.3 | 3,283.5 | -39,438.5 | 17,430.1 | 29,969.1 | 8,851.7 | 9,779.4 | 10,132.0 | 10,497.2 | 10,875.7 |
| WACC, % | 4.03 | 4.26 | 3.88 | 3.92 | 3.99 | 4.02 | 4.02 | 4.02 | 4.02 | 4.02 |
| PV UFCF | ||||||||||
| SUM PV UFCF | 44,451.2 | |||||||||
| Long Term Growth Rate, % | 3.50 | |||||||||
| Free cash flow (T + 1) | 11,256 | |||||||||
| Terminal Value | 2,180,197 | |||||||||
| Present Terminal Value | 1,790,560 | |||||||||
| Enterprise Value | 1,835,011 | |||||||||
| Net Debt | 35,145 | |||||||||
| Equity Value | 1,799,866 | |||||||||
| Diluted Shares Outstanding, MM | 72 | |||||||||
| Equity Value Per Share | 25,015.51 |
Benefits You Will Receive
- Genuine Tokuyama Financial Data: Pre-filled with historical and projected information for accurate analysis of (4043T).
- Customizable Template: Easily adjust key variables such as revenue growth, WACC, and EBITDA percentage.
- Instant Calculations: View the intrinsic value of Tokuyama in real-time as you make adjustments.
- Expert Valuation Tool: Crafted for investors, analysts, and consultants looking for reliable DCF results.
- User-Friendly Interface: Streamlined layout and straightforward instructions suitable for all skill levels.
Key Features
- Real-Time Tokuyama Data: Pre-populated with historical financials and future projections for Tokuyama Corporation (4043T).
- Fully Customizable Parameters: Modify revenue growth, profit margins, WACC, tax rates, and capital expenditures to match your analysis.
- Dynamic Valuation Framework: Instantaneous updates to Net Present Value (NPV) and intrinsic value according to your specifications.
- Scenario Analysis: Develop multiple forecast scenarios to evaluate different valuation results.
- User-Centric Interface: Intuitive and organized, catering to both seasoned professionals and newcomers.
How It Works
- Step 1: Download the prebuilt Excel template featuring Tokuyama Corporation’s (4043T) data.
- Step 2: Explore the pre-filled sheets to familiarize yourself with the key metrics.
- Step 3: Update the forecasts and assumptions in the editable yellow cells (WACC, growth, margins).
- Step 4: Instantly view the recalculated results, including the intrinsic value of Tokuyama Corporation (4043T).
- Step 5: Make informed investment decisions or generate reports based on the outputs.
Why Opt for the Tokuyama Corporation Calculator?
- Time-Efficient: There's no need to start a DCF model from scratch – our tool is ready to go.
- Enhanced Precision: Dependable financial data and formulas minimize valuation errors.
- Completely Customizable: Adjust the model to match your specific assumptions and forecasts.
- User-Friendly: Intuitive charts and outputs simplify the analysis of results.
- Preferred by Professionals: Crafted for those who prioritize accuracy and ease of use.
Who Can Benefit from This Product?
- Finance Students: Master valuation strategies and apply them using real-world data.
- Researchers: Utilize professional models for academic studies or coursework.
- Investors: Evaluate your own theories and assess valuation results for Tokuyama Corporation (4043T).
- Analysts: Optimize your processes with a ready-made, customizable DCF model.
- Small Business Owners: Discover how large public firms like Tokuyama Corporation (4043T) are assessed for value.
Contents of the Template
- Comprehensive DCF Model: An editable template featuring detailed valuation calculations.
- Real-World Data: Tokuyama Corporation’s (4043T) historical and projected financials preloaded for thorough analysis.
- Customizable Parameters: Modify WACC, growth rates, and tax assumptions to explore different scenarios.
- Financial Statements: Complete annual and quarterly breakdowns for enhanced insights.
- Key Ratios: Integrated analysis for assessing profitability, efficiency, and leverage.
- Dashboard with Visual Outputs: Charts and tables designed to present clear, actionable results.
Disclaimer
All information, articles, and product details provided on this website are for general informational and educational purposes only. We do not claim any ownership over, nor do we intend to infringe upon, any trademarks, copyrights, logos, brand names, or other intellectual property mentioned or depicted on this site. Such intellectual property remains the property of its respective owners, and any references here are made solely for identification or informational purposes, without implying any affiliation, endorsement, or partnership.
We make no representations or warranties, express or implied, regarding the accuracy, completeness, or suitability of any content or products presented. Nothing on this website should be construed as legal, tax, investment, financial, medical, or other professional advice. In addition, no part of this site—including articles or product references—constitutes a solicitation, recommendation, endorsement, advertisement, or offer to buy or sell any securities, franchises, or other financial instruments, particularly in jurisdictions where such activity would be unlawful.
All content is of a general nature and may not address the specific circumstances of any individual or entity. It is not a substitute for professional advice or services. Any actions you take based on the information provided here are strictly at your own risk. You accept full responsibility for any decisions or outcomes arising from your use of this website and agree to release us from any liability in connection with your use of, or reliance upon, the content or products found herein.