
|
DCF-Bewertung von Shin-emsu Chemical Co., Ltd. (4063.t) |
Fully Editable: Tailor To Your Needs In Excel Or Sheets
Professional Design: Trusted, Industry-Standard Templates
Investor-Approved Valuation Models
MAC/PC Compatible, Fully Unlocked
No Expertise Is Needed; Easy To Follow
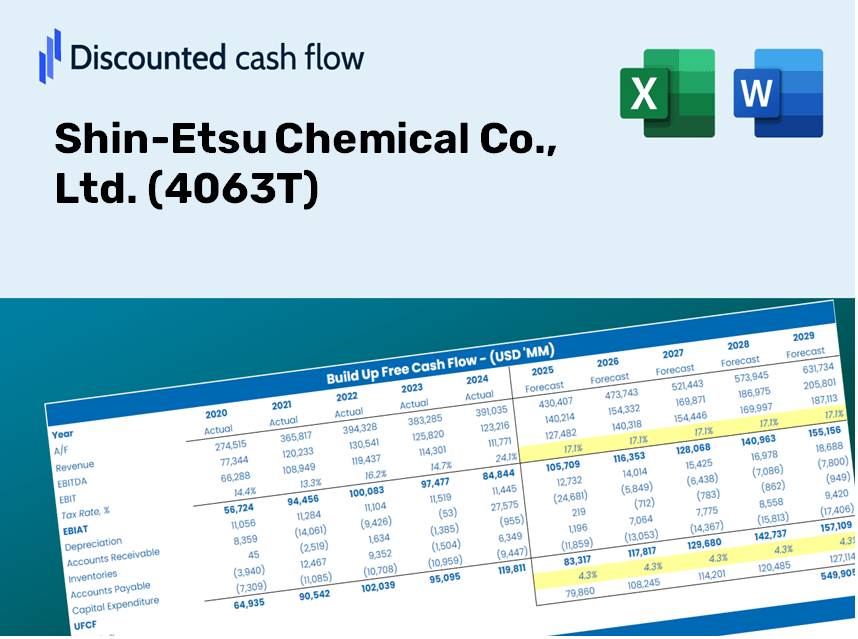
Shin-Etsu Chemical Co., Ltd. (4063.T) Bundle
Unabhängig davon, ob Sie ein Investor oder Analyst sind, ist dieser (4063T) DCF -Taschenrechner Ihr ultimatives Werkzeug für eine genaue Bewertung. Mit Shin-Etsu Chemical Co., Ltd. Real Data, können Sie Prognosen anpassen und die Effekte in Echtzeit beobachten.
Discounted Cash Flow (DCF) - (USD MM)
| Year | AY1 2021 |
AY2 2022 |
AY3 2023 |
AY4 2024 |
AY5 2025 |
FY1 2026 |
FY2 2027 |
FY3 2028 |
FY4 2029 |
FY5 2030 |
|---|---|---|---|---|---|---|---|---|---|---|
| Revenue | 1,496,906.0 | 2,074,428.0 | 2,808,824.0 | 2,414,937.0 | 2,561,249.0 | 2,983,975.5 | 3,476,471.8 | 4,050,253.1 | 4,718,735.4 | 5,497,548.6 |
| Revenue Growth, % | 0 | 38.58 | 35.4 | -14.02 | 6.06 | 16.5 | 16.5 | 16.5 | 16.5 | 16.5 |
| EBITDA | 547,335.0 | 865,908.0 | 1,211,834.0 | 1,024,794.0 | 1,064,586.0 | 1,226,121.6 | 1,428,489.3 | 1,664,257.2 | 1,938,937.9 | 2,258,953.8 |
| EBITDA, % | 36.56 | 41.74 | 43.14 | 42.44 | 41.57 | 41.09 | 41.09 | 41.09 | 41.09 | 41.09 |
| Depreciation | 144,461.0 | 168,788.0 | 213,632.0 | 227,619.0 | 238,357.0 | 263,334.2 | 306,796.8 | 357,432.7 | 416,425.9 | 485,155.7 |
| Depreciation, % | 9.65 | 8.14 | 7.61 | 9.43 | 9.31 | 8.82 | 8.82 | 8.82 | 8.82 | 8.82 |
| EBIT | 402,874.0 | 697,120.0 | 998,202.0 | 797,175.0 | 826,229.0 | 962,787.3 | 1,121,692.5 | 1,306,824.5 | 1,522,512.0 | 1,773,798.1 |
| EBIT, % | 26.91 | 33.61 | 35.54 | 33.01 | 32.26 | 32.27 | 32.27 | 32.27 | 32.27 | 32.27 |
| Total Cash | 1,152,921.0 | 1,436,080.0 | 1,600,648.0 | 1,719,709.0 | 1,811,678.0 | 2,060,017.0 | 2,400,016.7 | 2,796,132.3 | 3,257,625.6 | 3,795,287.0 |
| Total Cash, percent | .0 | .0 | .0 | .0 | .0 | .0 | .0 | .0 | .0 | .0 |
| Account Receivables | 337,868.0 | 467,695.0 | 466,862.0 | 474,763.0 | 504,761.0 | 603,390.5 | 702,978.3 | 819,002.8 | 954,176.7 | 1,111,660.8 |
| Account Receivables, % | 22.57 | 22.55 | 16.62 | 19.66 | 19.71 | 20.22 | 20.22 | 20.22 | 20.22 | 20.22 |
| Inventories | 365,031.0 | 453,659.0 | 688,477.0 | 720,645.0 | 769,966.0 | 779,828.1 | 908,536.4 | 1,058,487.6 | 1,233,187.8 | 1,436,721.8 |
| Inventories, % | 24.39 | 21.87 | 24.51 | 29.84 | 30.06 | 26.13 | 26.13 | 26.13 | 26.13 | 26.13 |
| Accounts Payable | 125,410.0 | 177,682.0 | 185,006.0 | 161,364.0 | 184,369.0 | 223,262.3 | 260,111.1 | 303,041.7 | 353,057.8 | 411,328.9 |
| Accounts Payable, % | 8.38 | 8.57 | 6.59 | 6.68 | 7.2 | 7.48 | 7.48 | 7.48 | 7.48 | 7.48 |
| Capital Expenditure | -236,195.0 | -195,775.0 | -295,517.0 | -374,417.0 | -439,473.0 | -408,209.0 | -475,582.7 | -554,076.3 | -645,524.9 | -752,066.9 |
| Capital Expenditure, % | -15.78 | -9.44 | -10.52 | -15.5 | -17.16 | -13.68 | -13.68 | -13.68 | -13.68 | -13.68 |
| Tax Rate, % | 35.37 | 35.37 | 35.37 | 35.37 | 35.37 | 35.37 | 35.37 | 35.37 | 35.37 | 35.37 |
| EBITAT | 294,264.5 | 500,823.2 | 692,959.2 | 521,121.9 | 534,021.0 | 662,991.5 | 772,416.3 | 899,901.3 | 1,048,427.4 | 1,221,467.2 |
| Depreciation | ||||||||||
| Changes in Account Receivables | ||||||||||
| Changes in Inventories | ||||||||||
| Changes in Accounts Payable | ||||||||||
| Capital Expenditure | ||||||||||
| UFCF | -374,958.5 | 307,653.2 | 384,413.2 | 310,612.9 | 276,591.0 | 448,518.5 | 412,183.0 | 480,212.6 | 559,470.3 | 651,809.2 |
| WACC, % | 8.97 | 8.97 | 8.97 | 8.97 | 8.97 | 8.97 | 8.97 | 8.97 | 8.97 | 8.97 |
| PV UFCF | ||||||||||
| SUM PV UFCF | 1,950,991.2 | |||||||||
| Long Term Growth Rate, % | 1.00 | |||||||||
| Free cash flow (T + 1) | 658,327 | |||||||||
| Terminal Value | 8,263,173 | |||||||||
| Present Terminal Value | 5,378,632 | |||||||||
| Enterprise Value | 7,329,623 | |||||||||
| Net Debt | -848,833 | |||||||||
| Equity Value | 8,178,456 | |||||||||
| Diluted Shares Outstanding, MM | 1,983 | |||||||||
| Equity Value Per Share | 4,124.55 |
Benefits You Will Receive
- Pre-Filled Financial Model: Utilize Shin-Etsu's historical data for accurate DCF valuation.
- Complete Forecast Control: Modify revenue growth, profit margins, WACC, and other critical factors.
- Real-Time Calculations: Automatic updates allow you to view results instantly as you adjust inputs.
- Professional-Grade Template: A polished Excel file crafted for high-quality valuation.
- Customizable and Reusable: Designed for adaptability, facilitating repeated use for comprehensive forecasts.
Key Features
- Pre-Loaded Data: Shin-Etsu Chemical’s historical financial statements and pre-filled forecasts.
- Fully Adjustable Inputs: Modify WACC, tax rates, revenue growth, and EBITDA margins as needed.
- Instant Results: Watch Shin-Etsu Chemical’s intrinsic value recalculate in real time.
- Clear Visual Outputs: Dashboard charts present valuation results and key metrics effectively.
- Built for Accuracy: A professional-grade tool for analysts, investors, and finance specialists.
How It Functions
- Download the Template: Gain immediate access to the Excel-based Shin-Etsu Chemical DCF Calculator.
- Input Your Assumptions: Modify the yellow-highlighted cells for growth rates, WACC, profit margins, and more.
- Instant Calculations: The model automatically recalculates the intrinsic value of Shin-Etsu Chemical.
- Test Scenarios: Experiment with various assumptions to assess potential changes in valuation.
- Analyze and Decide: Utilize the results to inform your investment or financial analysis.
Why Opt for This Calculator?
- User-Friendly Interface: Ideal for both newcomers and seasoned professionals.
- Customizable Parameters: Adjust inputs easily to suit your evaluation needs.
- Real-Time Adjustments: Witness immediate changes to Shin-Etsu Chemical's valuation as you tweak inputs.
- Pre-Configured: Comes with Shin-Etsu Chemical's actual financial metrics for expedited analysis.
- Relied Upon by Experts: Favored by investors and analysts for making well-informed choices.
Who Should Utilize This Product?
- Investors: Effectively determine the fair value of Shin-Etsu Chemical Co., Ltd. (4063T) prior to making investment choices.
- CFOs: Utilize a high-quality DCF model for comprehensive financial reporting and analysis.
- Consultants: Seamlessly modify the template for client valuation reports.
- Entrepreneurs: Discover insights into the financial modeling techniques adopted by Fortune 500 firms.
- Educators: Employ this as a resource for teaching valuation methodologies.
Contents of the Template
- Pre-Filled Data: Features Shin-Etsu Chemical's historical financials and forecasts.
- Discounted Cash Flow Model: An editable DCF valuation model with automatic calculations.
- Weighted Average Cost of Capital (WACC): A dedicated sheet for WACC calculations based on custom inputs.
- Key Financial Ratios: Assess Shin-Etsu Chemical's profitability, efficiency, and leverage.
- Customizable Inputs: Easily adjust revenue growth, margins, and tax rates.
- Clear Dashboard: Visualizations and tables that summarize essential valuation results.
Disclaimer
All information, articles, and product details provided on this website are for general informational and educational purposes only. We do not claim any ownership over, nor do we intend to infringe upon, any trademarks, copyrights, logos, brand names, or other intellectual property mentioned or depicted on this site. Such intellectual property remains the property of its respective owners, and any references here are made solely for identification or informational purposes, without implying any affiliation, endorsement, or partnership.
We make no representations or warranties, express or implied, regarding the accuracy, completeness, or suitability of any content or products presented. Nothing on this website should be construed as legal, tax, investment, financial, medical, or other professional advice. In addition, no part of this site—including articles or product references—constitutes a solicitation, recommendation, endorsement, advertisement, or offer to buy or sell any securities, franchises, or other financial instruments, particularly in jurisdictions where such activity would be unlawful.
All content is of a general nature and may not address the specific circumstances of any individual or entity. It is not a substitute for professional advice or services. Any actions you take based on the information provided here are strictly at your own risk. You accept full responsibility for any decisions or outcomes arising from your use of this website and agree to release us from any liability in connection with your use of, or reliance upon, the content or products found herein.