
|
ADEKA CORPORATION (4401.T) DCF -Bewertung |
Fully Editable: Tailor To Your Needs In Excel Or Sheets
Professional Design: Trusted, Industry-Standard Templates
Investor-Approved Valuation Models
MAC/PC Compatible, Fully Unlocked
No Expertise Is Needed; Easy To Follow
Adeka Corporation (4401.T) Bundle
Bewerten Sie die finanzielle Aussichten von ADEKA Corporation (4401T) wie ein Experte! Dieser (4401T) DCF-Taschenrechner verfügt über vorgefüllte Finanzdaten und bietet vollständige Flexibilität, um das Umsatzwachstum, die WACC, die Margen und die anderen wichtigen Annahmen zu ändern, um sich an Ihren Prognosen auszurichten.
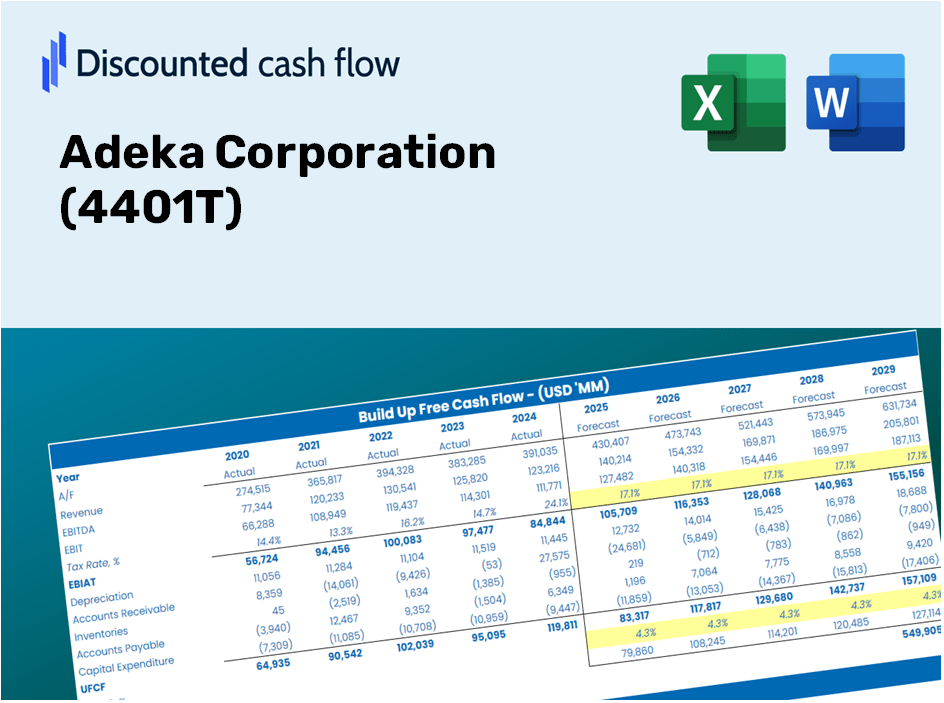
Discounted Cash Flow (DCF) - (USD MM)
| Year | AY1 2020 |
AY2 2021 |
AY3 2022 |
AY4 2023 |
AY5 2024 |
FY1 2025 |
FY2 2026 |
FY3 2027 |
FY4 2028 |
FY5 2029 |
|---|---|---|---|---|---|---|---|---|---|---|
| Revenue | 327,080.0 | 363,034.0 | 403,343.0 | 399,770.0 | 407,145.0 | 430,611.6 | 455,430.7 | 481,680.3 | 509,442.8 | 538,805.5 |
| Revenue Growth, % | 0 | 10.99 | 11.1 | -0.88585 | 1.84 | 5.76 | 5.76 | 5.76 | 5.76 | 5.76 |
| EBITDA | 43,739.0 | 53,375.0 | 47,665.0 | 56,472.0 | 59,916.0 | 59,196.0 | 62,607.9 | 66,216.4 | 70,032.9 | 74,069.4 |
| EBITDA, % | 13.37 | 14.7 | 11.82 | 14.13 | 14.72 | 13.75 | 13.75 | 13.75 | 13.75 | 13.75 |
| Depreciation | 15,069.0 | 15,604.0 | 16,003.0 | 17,065.0 | 17,555.0 | 18,476.1 | 19,541.1 | 20,667.3 | 21,858.5 | 23,118.4 |
| Depreciation, % | 4.61 | 4.3 | 3.97 | 4.27 | 4.31 | 4.29 | 4.29 | 4.29 | 4.29 | 4.29 |
| EBIT | 28,670.0 | 37,771.0 | 31,662.0 | 39,407.0 | 42,361.0 | 40,719.8 | 43,066.8 | 45,549.0 | 48,174.4 | 50,951.0 |
| EBIT, % | 8.77 | 10.4 | 7.85 | 9.86 | 10.4 | 9.46 | 9.46 | 9.46 | 9.46 | 9.46 |
| Total Cash | 86,743.0 | 86,748.0 | 86,618.0 | 103,927.0 | 115,610.0 | 108,757.6 | 115,026.0 | 121,655.8 | 128,667.6 | 136,083.6 |
| Total Cash, percent | .0 | .0 | .0 | .0 | .0 | .0 | .0 | .0 | .0 | .0 |
| Account Receivables | 90,506.0 | 99,077.0 | 98,449.0 | 115,559.0 | 108,682.0 | 116,239.8 | 122,939.5 | 130,025.4 | 137,519.6 | 145,445.8 |
| Account Receivables, % | 27.67 | 27.29 | 24.41 | 28.91 | 26.69 | 26.99 | 26.99 | 26.99 | 26.99 | 26.99 |
| Inventories | 69,779.0 | 96,081.0 | 116,713.0 | 114,619.0 | 113,365.0 | 114,759.3 | 121,373.7 | 128,369.3 | 135,768.1 | 143,593.4 |
| Inventories, % | 21.33 | 26.47 | 28.94 | 28.67 | 27.84 | 26.65 | 26.65 | 26.65 | 26.65 | 26.65 |
| Accounts Payable | 50,254.0 | 63,233.0 | 62,235.0 | 64,903.0 | 60,212.0 | 68,239.9 | 72,173.1 | 76,332.9 | 80,732.5 | 85,385.7 |
| Accounts Payable, % | 15.36 | 17.42 | 15.43 | 16.24 | 14.79 | 15.85 | 15.85 | 15.85 | 15.85 | 15.85 |
| Capital Expenditure | -14,452.0 | -13,599.0 | -17,856.0 | -21,751.0 | -14,046.0 | -18,500.9 | -19,567.3 | -20,695.1 | -21,887.9 | -23,149.4 |
| Capital Expenditure, % | -4.42 | -3.75 | -4.43 | -5.44 | -3.45 | -4.3 | -4.3 | -4.3 | -4.3 | -4.3 |
| Tax Rate, % | 35.7 | 35.7 | 35.7 | 35.7 | 35.7 | 35.7 | 35.7 | 35.7 | 35.7 | 35.7 |
| EBITAT | 16,981.1 | 24,153.2 | 18,197.6 | 25,375.7 | 27,236.3 | 25,192.5 | 26,644.6 | 28,180.3 | 29,804.5 | 31,522.3 |
| Depreciation | ||||||||||
| Changes in Account Receivables | ||||||||||
| Changes in Inventories | ||||||||||
| Changes in Accounts Payable | ||||||||||
| Capital Expenditure | ||||||||||
| UFCF | -92,432.9 | 4,264.2 | -4,657.4 | 8,341.7 | 34,185.3 | 24,243.5 | 17,237.4 | 18,230.9 | 19,281.7 | 20,393.0 |
| WACC, % | 6.67 | 6.71 | 6.66 | 6.71 | 6.71 | 6.69 | 6.69 | 6.69 | 6.69 | 6.69 |
| PV UFCF | ||||||||||
| SUM PV UFCF | 82,507.6 | |||||||||
| Long Term Growth Rate, % | 3.00 | |||||||||
| Free cash flow (T + 1) | 21,005 | |||||||||
| Terminal Value | 568,869 | |||||||||
| Present Terminal Value | 411,477 | |||||||||
| Enterprise Value | 493,985 | |||||||||
| Net Debt | -46,080 | |||||||||
| Equity Value | 540,065 | |||||||||
| Diluted Shares Outstanding, MM | 102 | |||||||||
| Equity Value Per Share | 5,300.42 |
What You Will Receive
- Customizable Excel Template: A fully adjustable Excel-based DCF Calculator featuring pre-filled real Adeka Corporation (4401T) financial data.
- Comprehensive Data: Historical figures and projected estimates (displayed in the highlighted cells).
- Assumption Flexibility: Modify forecast variables such as revenue growth, EBITDA %, and WACC.
- Instant Calculations: Quickly view how your inputs affect Adeka Corporation’s valuation.
- Professional Resource: Designed for investors, CFOs, consultants, and financial analysts.
- User-Friendly Interface: Organized for clarity and ease of use, complete with straightforward instructions.
Key Features
- Genuine Adeka Financials: Gain access to precise pre-loaded historical data and future forecasts.
- Editable Forecast Parameters: Modify yellow-highlighted fields such as WACC, growth rates, and profit margins.
- Automated Analytics: Real-time updates for DCF, Net Present Value (NPV), and cash flow analysis.
- User-Friendly Dashboard: Intuitive charts and summaries to help visualize your valuation outcomes.
- Designed for Everyone: A straightforward layout suitable for investors, CFOs, and consultants alike.
How It Operates
- Download: Obtain the pre-configured Excel spreadsheet featuring Adeka Corporation’s (4401T) financial data.
- Customize: Modify projections for key metrics such as revenue growth, EBITDA percentage, and WACC.
- Update Automatically: Watch as intrinsic value and NPV calculations refresh in real-time.
- Test Scenarios: Generate various projections and instantly analyze the results.
- Make Decisions: Leverage the valuation insights to shape your investment approach.
Why Opt for the Adeka Corporation Calculator?
- Time Efficient: Skip building a DCF model from the ground up – it's ready for immediate use.
- Enhanced Accuracy: Dependable financial data and formulas minimize valuation errors.
- Completely Customizable: Adjust the model to align with your unique assumptions and forecasts.
- Simple to Analyze: Intuitive charts and outputs make results straightforward to interpret.
- Endorsed by Professionals: Crafted for users who prioritize accuracy and functionality.
Who Should Use This Product?
- Investors: Assess Adeka Corporation's (4401T) valuation before making stock decisions.
- CFOs and Financial Analysts: Enhance valuation workflows and validate financial projections.
- Startup Founders: Discover how leading public companies like Adeka Corporation are valued.
- Consultants: Provide detailed valuation reports for your clients regarding Adeka Corporation (4401T).
- Students and Educators: Utilize real data to practice and teach effective valuation methods.
Contents of the Template
- Preloaded Adeka Data: Historical and projected financial metrics, including revenue, EBIT, and capital expenditures.
- DCF and WACC Models: Advanced sheets designed for calculating intrinsic value and Weighted Average Cost of Capital.
- Editable Inputs: Cells highlighted in yellow for modifying revenue growth, tax rates, and discount rates.
- Financial Statements: Detailed annual and quarterly financial performance for enhanced analysis.
- Key Ratios: Analysis of profitability, leverage, and efficiency ratios to assess performance.
- Dashboard and Charts: Visual representations of valuation results and underlying assumptions.
Disclaimer
All information, articles, and product details provided on this website are for general informational and educational purposes only. We do not claim any ownership over, nor do we intend to infringe upon, any trademarks, copyrights, logos, brand names, or other intellectual property mentioned or depicted on this site. Such intellectual property remains the property of its respective owners, and any references here are made solely for identification or informational purposes, without implying any affiliation, endorsement, or partnership.
We make no representations or warranties, express or implied, regarding the accuracy, completeness, or suitability of any content or products presented. Nothing on this website should be construed as legal, tax, investment, financial, medical, or other professional advice. In addition, no part of this site—including articles or product references—constitutes a solicitation, recommendation, endorsement, advertisement, or offer to buy or sell any securities, franchises, or other financial instruments, particularly in jurisdictions where such activity would be unlawful.
All content is of a general nature and may not address the specific circumstances of any individual or entity. It is not a substitute for professional advice or services. Any actions you take based on the information provided here are strictly at your own risk. You accept full responsibility for any decisions or outcomes arising from your use of this website and agree to release us from any liability in connection with your use of, or reliance upon, the content or products found herein.