
|
Astellas Pharma Inc. (4503.t) DCF -Bewertung |
Fully Editable: Tailor To Your Needs In Excel Or Sheets
Professional Design: Trusted, Industry-Standard Templates
Investor-Approved Valuation Models
MAC/PC Compatible, Fully Unlocked
No Expertise Is Needed; Easy To Follow
Astellas Pharma Inc. (4503.T) Bundle
Vereinfachen Sie die Bewertung der Astellas Pharma Inc. (4503T) mit diesem anpassbaren DCF -Taschenrechner! Mit Real Astellas Pharma Inc. (4503T) Finanzdaten und einstellbaren Prognoseeingaben können Sie Szenarien testen und Astellas Pharma Inc. (4503T) in Minuten aufdecken.
What You Will Receive
- Pre-Filled Financial Model: Astellas Pharma’s actual data facilitates accurate DCF valuation.
- Comprehensive Forecast Control: Modify revenue growth, profit margins, WACC, and other essential drivers.
- Real-Time Calculations: Automatic updates provide immediate results as you adjust your inputs.
- Professional-Grade Template: A polished Excel file crafted for expert-level valuation.
- Adaptable and Reusable: Designed for versatility, enabling repeated use for in-depth forecasts.
Key Features
- 🔍 Real-Life Astellas Financials: Pre-filled historical and projected data for Astellas Pharma Inc. (4503T).
- ✏️ Fully Customizable Inputs: Modify all essential parameters (yellow cells) such as WACC, growth %, and tax rates.
- 📊 Professional DCF Valuation: Integrated formulas that compute Astellas's intrinsic value using the Discounted Cash Flow method.
- ⚡ Instant Results: Visualize Astellas's valuation immediately after making adjustments.
- Scenario Analysis: Explore and compare outcomes for different financial assumptions side-by-side.
How It Functions
- Download: Obtain the pre-prepared Excel file featuring Astellas Pharma Inc.'s (4503T) financial data.
- Customize: Modify forecasts, including revenue growth, EBITDA %, and WACC.
- Update Automatically: The intrinsic value and NPV calculations refresh in real-time.
- Test Scenarios: Generate various projections and compare the results instantly.
- Make Decisions: Leverage the valuation outcomes to inform your investment strategy.
Why Choose This Calculator for Astellas Pharma Inc. (4503T)?
- User-Friendly Interface: Perfect for both novices and seasoned professionals.
- Customizable Inputs: Adjust parameters easily to fit your analytical needs.
- Real-Time Valuation: Monitor immediate updates to Astellas’s valuation as you tweak inputs.
- Pre-Loaded Data: Comes equipped with Astellas’s actual financial metrics for swift analysis.
- Relied Upon by Experts: Utilized by investors and analysts for informed decision-making.
Who Should Use This Product?
- Professional Investors: Develop comprehensive and reliable valuation models for analyzing portfolios related to Astellas Pharma Inc. (4503T).
- Corporate Finance Teams: Evaluate valuation scenarios to inform strategic decisions within the organization.
- Consultants and Advisors: Equip clients with precise valuation insights pertaining to Astellas Pharma Inc. (4503T).
- Students and Educators: Utilize real-world data to enhance learning and practice in financial modeling.
- Pharmaceutical Enthusiasts: Gain an understanding of how companies like Astellas Pharma Inc. (4503T) are valued within the industry.
Contents of the Template
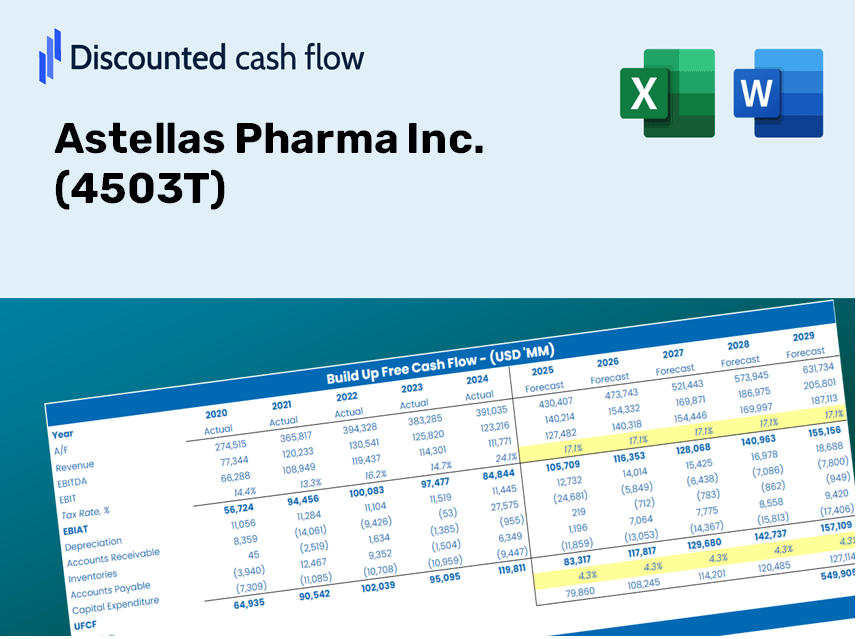
- Operating and Balance Sheet Data: Pre-filled historical data and forecasts for Astellas Pharma Inc. (4503T), including metrics such as revenue, EBITDA, EBIT, and capital expenditures.
- WACC Calculation: A separate sheet dedicated to the Weighted Average Cost of Capital (WACC) calculation, featuring key parameters like Beta, risk-free rate, and share price.
- DCF Valuation (Unlevered and Levered): Customizable Discounted Cash Flow models that present intrinsic value with comprehensive calculations.
- Financial Statements: Pre-loaded annual and quarterly financial statements for Astellas Pharma Inc. (4503T) to facilitate thorough analysis.
- Key Ratios: A compilation of important profitability, leverage, and efficiency ratios relevant to Astellas Pharma Inc. (4503T).
- Dashboard and Charts: A visual summary of valuation outputs and assumptions to simplify the analysis of results.
Disclaimer
All information, articles, and product details provided on this website are for general informational and educational purposes only. We do not claim any ownership over, nor do we intend to infringe upon, any trademarks, copyrights, logos, brand names, or other intellectual property mentioned or depicted on this site. Such intellectual property remains the property of its respective owners, and any references here are made solely for identification or informational purposes, without implying any affiliation, endorsement, or partnership.
We make no representations or warranties, express or implied, regarding the accuracy, completeness, or suitability of any content or products presented. Nothing on this website should be construed as legal, tax, investment, financial, medical, or other professional advice. In addition, no part of this site—including articles or product references—constitutes a solicitation, recommendation, endorsement, advertisement, or offer to buy or sell any securities, franchises, or other financial instruments, particularly in jurisdictions where such activity would be unlawful.
All content is of a general nature and may not address the specific circumstances of any individual or entity. It is not a substitute for professional advice or services. Any actions you take based on the information provided here are strictly at your own risk. You accept full responsibility for any decisions or outcomes arising from your use of this website and agree to release us from any liability in connection with your use of, or reliance upon, the content or products found herein.