
|
Rohto Pharmaceutical Co., Ltd. (4527.t) DCF -Bewertung |
Fully Editable: Tailor To Your Needs In Excel Or Sheets
Professional Design: Trusted, Industry-Standard Templates
Investor-Approved Valuation Models
MAC/PC Compatible, Fully Unlocked
No Expertise Is Needed; Easy To Follow
Rohto Pharmaceutical Co.,Ltd. (4527.T) Bundle
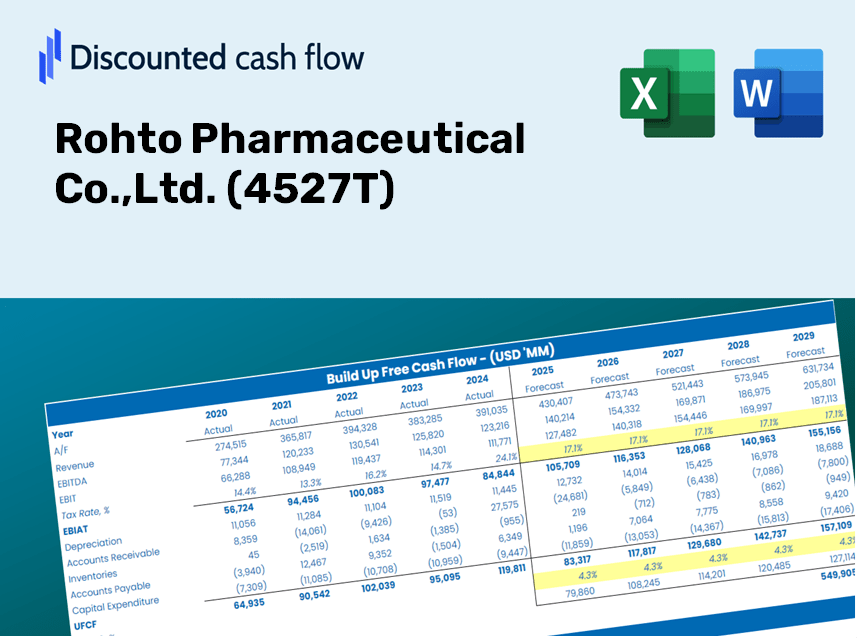
Gewinnen Sie Einblick in Ihre Rohto Pharmaceutical Co., Ltd. (4527T) Bewertungsanalyse mit unserem ausgefeilten DCF -Taschenrechner! Diese Excel -Vorlage wird mit realen (4527T) Daten vorinstalliert, sodass Sie Vorhersagen und Annahmen für eine genaue Berechnung des intrinsischen Wertes von Rohto anpassen können.
What You Will Receive
- Comprehensive 4527T Financial Data: Pre-loaded with Rohto Pharmaceutical’s historical and projected financial information for in-depth analysis.
- Fully Customizable Template: Easily adjust key metrics such as revenue growth, WACC, and EBITDA percentage.
- Real-Time Calculations: Instantly see updates to Rohto Pharmaceutical’s intrinsic value as you modify inputs.
- Expert Valuation Tool: Tailored for investors, analysts, and consultants aiming for precise DCF outcomes.
- Intuitive User Interface: A straightforward layout and clear guidance suitable for users of all experience levels.
Key Features
- Pre-Loaded Data: Rohto Pharmaceutical's historical financial statements and pre-filled forecasts.
- Fully Adjustable Inputs: Customize WACC, tax rates, revenue growth, and EBITDA margins.
- Instant Results: View Rohto Pharmaceutical's intrinsic value recalculating in real time.
- Clear Visual Outputs: Dashboard charts showcase valuation results and essential metrics.
- Built for Accuracy: A professional tool designed for analysts, investors, and finance professionals.
How It Works
- 1. Access the Template: Download and open the Excel file featuring Rohto Pharmaceutical Co., Ltd.'s (4527T) preloaded data.
- 2. Modify Assumptions: Adjust key inputs such as growth rates, WACC, and capital expenditures to fit your analysis.
- 3. Instant Results: The DCF model automatically calculates the intrinsic value and NPV based on your adjustments.
- 4. Evaluate Scenarios: Analyze various forecasts to explore different potential valuation outcomes.
- 5. Present with Confidence: Share professional valuation insights to bolster your decision-making process.
Why Choose Rohto Pharmaceutical's Calculator?
- Save Time: Skip the hassle of building a DCF model from the ground up – it's ready for your use.
- Enhance Accuracy: Dependable financial data and calculations minimize valuation errors.
- Completely Customizable: Adjust the model to suit your specific assumptions and forecasts.
- Simple to Understand: Intuitive charts and outputs ensure the results are straightforward to analyze.
- Trusted by Industry Professionals: Crafted for experts who prioritize precision and usability.
Who Can Benefit from This Product?
- Investors: Make informed decisions with a comprehensive valuation tool tailored for professionals.
- Financial Analysts: Streamline your workflow with a customizable DCF model that’s ready to use.
- Consultants: Easily modify the template for client presentations or detailed reports.
- Finance Enthusiasts: Enhance your grasp of valuation methods with practical, real-world applications.
- Educators and Students: Utilize this resource as an effective learning aid in finance courses.
What the Template Contains
- Historical Data: Provides Rohto Pharmaceutical’s past financial performance and baseline forecasts.
- DCF and Levered DCF Models: Comprehensive templates to determine Rohto Pharmaceutical's intrinsic value.
- WACC Sheet: Built-in calculations for the Weighted Average Cost of Capital.
- Editable Inputs: Adjust essential drivers such as growth rates, EBITDA margins, and CAPEX estimates.
- Quarterly and Annual Statements: A detailed overview of Rohto Pharmaceutical’s financial results.
- Interactive Dashboard: Dynamically visualize valuation outcomes and forecasts.
Disclaimer
All information, articles, and product details provided on this website are for general informational and educational purposes only. We do not claim any ownership over, nor do we intend to infringe upon, any trademarks, copyrights, logos, brand names, or other intellectual property mentioned or depicted on this site. Such intellectual property remains the property of its respective owners, and any references here are made solely for identification or informational purposes, without implying any affiliation, endorsement, or partnership.
We make no representations or warranties, express or implied, regarding the accuracy, completeness, or suitability of any content or products presented. Nothing on this website should be construed as legal, tax, investment, financial, medical, or other professional advice. In addition, no part of this site—including articles or product references—constitutes a solicitation, recommendation, endorsement, advertisement, or offer to buy or sell any securities, franchises, or other financial instruments, particularly in jurisdictions where such activity would be unlawful.
All content is of a general nature and may not address the specific circumstances of any individual or entity. It is not a substitute for professional advice or services. Any actions you take based on the information provided here are strictly at your own risk. You accept full responsibility for any decisions or outcomes arising from your use of this website and agree to release us from any liability in connection with your use of, or reliance upon, the content or products found herein.