
|
H.U. Gruppe Holdings, Inc. (4544.t) DCF -Bewertung |
Fully Editable: Tailor To Your Needs In Excel Or Sheets
Professional Design: Trusted, Industry-Standard Templates
Investor-Approved Valuation Models
MAC/PC Compatible, Fully Unlocked
No Expertise Is Needed; Easy To Follow
H.U. Group Holdings, Inc. (4544.T) Bundle
Optimieren Sie Ihre Zeit und steigern Sie die Präzision mit unserem (4544T) DCF -Taschenrechner! Einbeziehung authentischer H.U. In diesem Tool können Sie Daten und anpassbare Annahmen anpassbaren Annahmen ermöglichen, die Prognose, Analyse und Wert H.U. Group Holdings, Inc. wie ein erfahrener Investor.
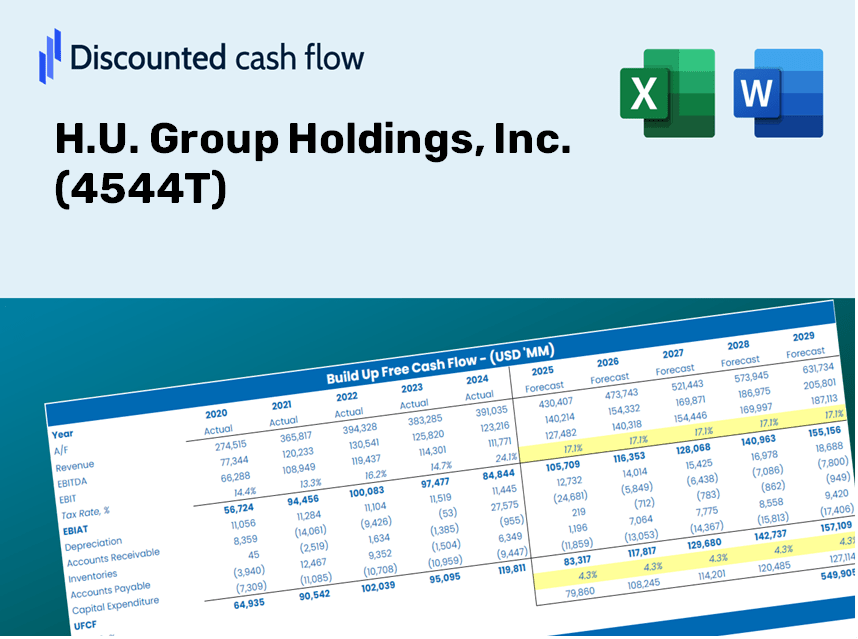
Discounted Cash Flow (DCF) - (USD MM)
| Year | AY1 2021 |
AY2 2022 |
AY3 2023 |
AY4 2024 |
AY5 2025 |
FY1 2026 |
FY2 2027 |
FY3 2028 |
FY4 2029 |
FY5 2030 |
|---|---|---|---|---|---|---|---|---|---|---|
| Revenue | 223,016.0 | 272,944.0 | 260,908.0 | 236,950.0 | 243,025.0 | 249,926.4 | 257,023.9 | 264,322.8 | 271,829.1 | 279,548.5 |
| Revenue Growth, % | 0 | 22.39 | -4.41 | -9.18 | 2.56 | 2.84 | 2.84 | 2.84 | 2.84 | 2.84 |
| EBITDA | 33,626.0 | 56,344.0 | 43,075.0 | 13,647.0 | 24,551.0 | 34,036.1 | 35,002.7 | 35,996.7 | 37,018.9 | 38,070.2 |
| EBITDA, % | 15.08 | 20.64 | 16.51 | 5.76 | 10.1 | 13.62 | 13.62 | 13.62 | 13.62 | 13.62 |
| Depreciation | 12,494.0 | 14,626.0 | 19,694.0 | 20,870.0 | 20,746.0 | 17,921.5 | 18,430.4 | 18,953.8 | 19,492.0 | 20,045.6 |
| Depreciation, % | 5.6 | 5.36 | 7.55 | 8.81 | 8.54 | 7.17 | 7.17 | 7.17 | 7.17 | 7.17 |
| EBIT | 21,132.0 | 41,718.0 | 23,381.0 | -7,223.0 | 3,805.0 | 16,114.6 | 16,572.3 | 17,042.9 | 17,526.9 | 18,024.6 |
| EBIT, % | 9.48 | 15.28 | 8.96 | -3.05 | 1.57 | 6.45 | 6.45 | 6.45 | 6.45 | 6.45 |
| Total Cash | 42,961.0 | 46,711.0 | 44,412.0 | 39,947.0 | 40,885.0 | 43,528.0 | 44,764.2 | 46,035.4 | 47,342.7 | 48,687.1 |
| Total Cash, percent | .0 | .0 | .0 | .0 | .0 | .0 | .0 | .0 | .0 | .0 |
| Account Receivables | 46,846.0 | 58,784.0 | 46,402.0 | 46,935.0 | 45,965.0 | 49,510.0 | 50,916.0 | 52,361.9 | 53,848.9 | 55,378.1 |
| Account Receivables, % | 21.01 | 21.54 | 17.78 | 19.81 | 18.91 | 19.81 | 19.81 | 19.81 | 19.81 | 19.81 |
| Inventories | 18,802.0 | 19,484.0 | 22,128.0 | 22,461.0 | 21,272.0 | 21,135.1 | 21,735.3 | 22,352.5 | 22,987.3 | 23,640.1 |
| Inventories, % | 8.43 | 7.14 | 8.48 | 9.48 | 8.75 | 8.46 | 8.46 | 8.46 | 8.46 | 8.46 |
| Accounts Payable | 18,150.0 | 21,307.0 | 20,512.0 | 20,820.0 | 19,209.0 | 20,242.7 | 20,817.6 | 21,408.8 | 22,016.7 | 22,642.0 |
| Accounts Payable, % | 8.14 | 7.81 | 7.86 | 8.79 | 7.9 | 8.1 | 8.1 | 8.1 | 8.1 | 8.1 |
| Capital Expenditure | -21,188.0 | -35,125.0 | -21,686.0 | -17,557.0 | -4,083.0 | -19,879.6 | -20,444.2 | -21,024.8 | -21,621.8 | -22,235.8 |
| Capital Expenditure, % | -9.5 | -12.87 | -8.31 | -7.41 | -1.68 | -7.95 | -7.95 | -7.95 | -7.95 | -7.95 |
| Tax Rate, % | 14.15 | 14.15 | 14.15 | 14.15 | 14.15 | 14.15 | 14.15 | 14.15 | 14.15 | 14.15 |
| EBITAT | 17,727.2 | 29,881.9 | 16,000.4 | -7,160.4 | 3,266.5 | 13,179.5 | 13,553.8 | 13,938.7 | 14,334.6 | 14,741.6 |
| Depreciation | ||||||||||
| Changes in Account Receivables | ||||||||||
| Changes in Inventories | ||||||||||
| Changes in Accounts Payable | ||||||||||
| Capital Expenditure | ||||||||||
| UFCF | -38,464.8 | -80.1 | 22,951.4 | -4,405.4 | 20,477.5 | 8,847.0 | 10,108.7 | 10,395.8 | 10,691.0 | 10,994.6 |
| WACC, % | 4.99 | 4.86 | 4.82 | 5.15 | 5.01 | 4.96 | 4.96 | 4.96 | 4.96 | 4.96 |
| PV UFCF | ||||||||||
| SUM PV UFCF | 44,030.0 | |||||||||
| Long Term Growth Rate, % | 0.50 | |||||||||
| Free cash flow (T + 1) | 11,050 | |||||||||
| Terminal Value | 247,516 | |||||||||
| Present Terminal Value | 194,267 | |||||||||
| Enterprise Value | 238,297 | |||||||||
| Net Debt | 45,767 | |||||||||
| Equity Value | 192,530 | |||||||||
| Diluted Shares Outstanding, MM | 57 | |||||||||
| Equity Value Per Share | 3,388.54 |
What You Will Receive
- Authentic H.U. Group Financials: Access both historical and projected data for precise valuation.
- Customizable Inputs: Adjust WACC, tax rates, revenue growth, and capital expenditures as needed.
- Dynamic Calculations: Intrinsic value and NPV are updated automatically.
- Scenario Analysis: Evaluate various scenarios to assess H.U. Group's future trajectory.
- User-Friendly and Professional Design: Crafted for experts while remaining approachable for newcomers.
Key Features
- Authentic H.U. Group Financials: Gain access to reliable pre-loaded historical data and future projections for [4544T].
- Adjustable Forecast Assumptions: Modify yellow-highlighted fields including WACC, growth rates, and margins as needed.
- Real-Time Calculations: Automatically updated DCF, Net Present Value (NPV), and cash flow analysis.
- Interactive Dashboard: User-friendly charts and summaries that help you visualize your valuation outcomes.
- Designed for All Skill Levels: An intuitive layout tailored for investors, CFOs, and consultants alike.
How It Works
- Download: Get instant access to the pre-built Excel file featuring H.U. Group Holdings, Inc. (4544T)'s financial data.
- Customize: Tailor your forecasts, including revenue growth, EBITDA %, and WACC.
- Update Automatically: Watch as intrinsic value and NPV calculations refresh in real-time.
- Test Scenarios: Generate multiple projections and instantly compare the results.
- Make Decisions: Leverage the valuation outcomes to inform your investment strategy.
Why Opt for This Calculator?
- Reliable Data: Authentic H.U. Group Holdings, Inc. (4544T) financials guarantee dependable valuation outcomes.
- Tailor-Made: Modify essential variables like growth rates, WACC, and tax rates to align with your forecasts.
- Efficiency Boost: Pre-configured calculations save you the hassle of starting from the ground up.
- Expert-Level Tool: Crafted for investors, analysts, and consultants seeking precision.
- Easy to Use: User-friendly design and clear, step-by-step guidance ensure accessibility for everyone.
Who Can Benefit from H.U. Group Holdings, Inc. (4544T)?
- Individual Investors: Make well-informed choices regarding the acquisition or sale of H.U. Group Holdings stock.
- Financial Analysts: Enhance valuation processes with comprehensive financial models tailored for H.U. Group Holdings.
- Consultants: Provide clients with quick and precise valuation insights related to H.U. Group Holdings.
- Business Owners: Gain insights into how major firms like H.U. Group Holdings are valued to inform your strategic decisions.
- Finance Students: Master valuation methodologies by analyzing real-world data and case studies related to H.U. Group Holdings.
Contents of the Template
- Pre-Filled Data: Features H.U. Group Holdings, Inc.’s historical financials and projected forecasts.
- Discounted Cash Flow Model: A customizable DCF valuation model with automated calculations.
- Weighted Average Cost of Capital (WACC): A specific sheet to compute WACC based on user-defined inputs.
- Key Financial Ratios: Evaluate H.U. Group Holdings, Inc.’s profitability, efficiency, and leverage metrics.
- Customizable Inputs: Easily adjust revenue growth, margins, and tax rates as needed.
- User-Friendly Dashboard: Visuals and tables that present key valuation outcomes clearly.
Disclaimer
All information, articles, and product details provided on this website are for general informational and educational purposes only. We do not claim any ownership over, nor do we intend to infringe upon, any trademarks, copyrights, logos, brand names, or other intellectual property mentioned or depicted on this site. Such intellectual property remains the property of its respective owners, and any references here are made solely for identification or informational purposes, without implying any affiliation, endorsement, or partnership.
We make no representations or warranties, express or implied, regarding the accuracy, completeness, or suitability of any content or products presented. Nothing on this website should be construed as legal, tax, investment, financial, medical, or other professional advice. In addition, no part of this site—including articles or product references—constitutes a solicitation, recommendation, endorsement, advertisement, or offer to buy or sell any securities, franchises, or other financial instruments, particularly in jurisdictions where such activity would be unlawful.
All content is of a general nature and may not address the specific circumstances of any individual or entity. It is not a substitute for professional advice or services. Any actions you take based on the information provided here are strictly at your own risk. You accept full responsibility for any decisions or outcomes arising from your use of this website and agree to release us from any liability in connection with your use of, or reliance upon, the content or products found herein.