
|
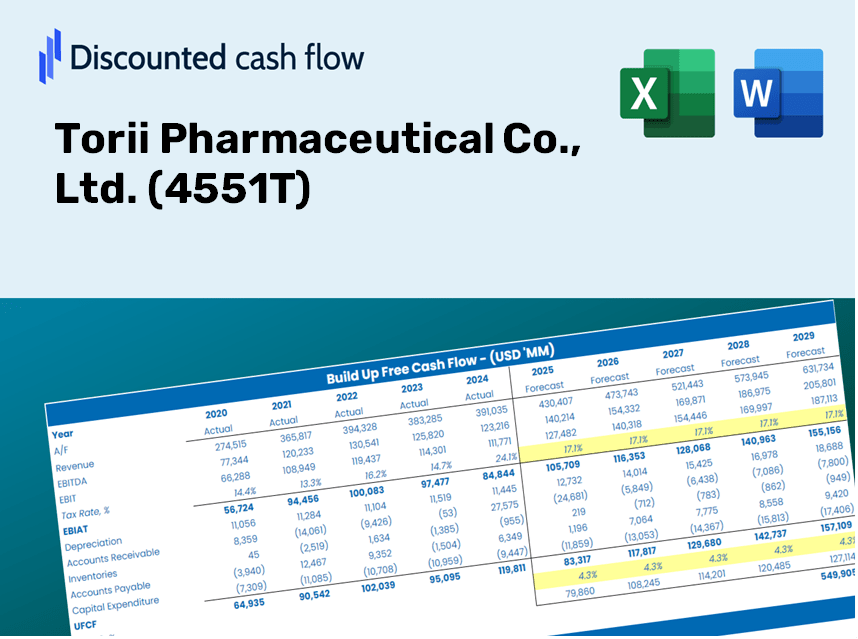
Torii Pharmaceutical Co., Ltd. (4551.t) DCF -Bewertung |
Fully Editable: Tailor To Your Needs In Excel Or Sheets
Professional Design: Trusted, Industry-Standard Templates
Investor-Approved Valuation Models
MAC/PC Compatible, Fully Unlocked
No Expertise Is Needed; Easy To Follow
Torii Pharmaceutical Co., Ltd. (4551.T) Bundle
Verbessern Sie Ihre Anlagestrategien mit dem DCF -Taschenrechner (4551T)! Tauchen Sie in die neuesten Finanzdaten von Torii Pharmaceutical Co., Ltd., stellen Sie Wachstumsprognosen und -kosten an und beobachten Sie sofort, wie sich diese Modifikationen auf den intrinsischen Wert von (4551T) auswirken.
Discounted Cash Flow (DCF) - (USD MM)
| Year | AY1 2020 |
AY2 2021 |
AY3 2022 |
AY4 2023 |
AY5 2024 |
FY1 2025 |
FY2 2026 |
FY3 2027 |
FY4 2028 |
FY5 2029 |
|---|---|---|---|---|---|---|---|---|---|---|
| Revenue | 41,699.0 | 46,987.0 | 48,894.0 | 54,638.0 | 60,426.0 | 57,634.5 | 54,972.0 | 52,432.5 | 50,010.3 | 47,700.0 |
| Revenue Growth, % | 0 | 12.68 | 4.06 | 11.75 | 10.59 | -4.62 | -4.62 | -4.62 | -4.62 | -4.62 |
| EBITDA | 4,688.0 | 5,047.0 | 5,975.0 | 5,830.0 | 7,207.0 | 6,547.4 | 6,245.0 | 5,956.5 | 5,681.3 | 5,418.8 |
| EBITDA, % | 11.24 | 10.74 | 12.22 | 10.67 | 11.93 | 11.36 | 11.36 | 11.36 | 11.36 | 11.36 |
| Depreciation | 461.0 | 279.0 | 252.0 | 459.0 | 408.0 | 430.0 | 410.1 | 391.1 | 373.1 | 355.8 |
| Depreciation, % | 1.11 | 0.59378 | 0.5154 | 0.84007 | 0.67521 | 0.746 | 0.746 | 0.746 | 0.746 | 0.746 |
| EBIT | 4,227.0 | 4,768.0 | 5,723.0 | 5,371.0 | 6,799.0 | 6,117.5 | 5,834.9 | 5,565.3 | 5,308.2 | 5,063.0 |
| EBIT, % | 10.14 | 10.15 | 11.7 | 9.83 | 11.25 | 10.61 | 10.61 | 10.61 | 10.61 | 10.61 |
| Total Cash | 70,104.0 | 65,572.0 | 58,909.0 | 44,003.0 | 43,298.0 | 52,123.5 | 49,715.6 | 47,418.9 | 45,228.3 | 43,139.0 |
| Total Cash, percent | .0 | .0 | .0 | .0 | .0 | .0 | .0 | .0 | .0 | .0 |
| Account Receivables | 18,955.0 | 22,010.0 | 22,865.0 | 28,502.0 | 31,068.0 | 27,969.4 | 26,677.3 | 25,444.9 | 24,269.4 | 23,148.3 |
| Account Receivables, % | 45.46 | 46.84 | 46.76 | 52.17 | 51.41 | 48.53 | 48.53 | 48.53 | 48.53 | 48.53 |
| Inventories | 7,151.0 | 8,763.0 | 8,969.0 | 10,742.0 | 14,217.0 | 11,219.2 | 10,701.0 | 10,206.6 | 9,735.1 | 9,285.4 |
| Inventories, % | 17.15 | 18.65 | 18.34 | 19.66 | 23.53 | 19.47 | 19.47 | 19.47 | 19.47 | 19.47 |
| Accounts Payable | 5,143.0 | 5,793.0 | 6,584.0 | 6,981.0 | 10,448.0 | 7,860.9 | 7,497.7 | 7,151.4 | 6,821.0 | 6,505.9 |
| Accounts Payable, % | 12.33 | 12.33 | 13.47 | 12.78 | 17.29 | 13.64 | 13.64 | 13.64 | 13.64 | 13.64 |
| Capital Expenditure | -411.0 | -374.0 | -281.0 | -216.0 | -152.0 | -346.2 | -330.2 | -314.9 | -300.4 | -286.5 |
| Capital Expenditure, % | -0.98564 | -0.79596 | -0.57471 | -0.39533 | -0.25155 | -0.60064 | -0.60064 | -0.60064 | -0.60064 | -0.60064 |
| Tax Rate, % | 25.03 | 25.03 | 25.03 | 25.03 | 25.03 | 25.03 | 25.03 | 25.03 | 25.03 | 25.03 |
| EBITAT | 3,496.7 | 3,374.7 | 3,944.7 | 3,955.5 | 5,097.5 | 4,539.7 | 4,330.0 | 4,130.0 | 3,939.2 | 3,757.2 |
| Depreciation | ||||||||||
| Changes in Account Receivables | ||||||||||
| Changes in Inventories | ||||||||||
| Changes in Accounts Payable | ||||||||||
| Capital Expenditure | ||||||||||
| UFCF | -17,416.3 | -737.3 | 3,645.7 | -2,814.5 | 2,779.5 | 8,132.8 | 5,857.2 | 5,586.6 | 5,328.5 | 5,082.3 |
| WACC, % | 4.7 | 4.7 | 4.7 | 4.7 | 4.7 | 4.7 | 4.7 | 4.7 | 4.7 | 4.7 |
| PV UFCF | ||||||||||
| SUM PV UFCF | 26,452.5 | |||||||||
| Long Term Growth Rate, % | 3.00 | |||||||||
| Free cash flow (T + 1) | 5,235 | |||||||||
| Terminal Value | 308,039 | |||||||||
| Present Terminal Value | 244,842 | |||||||||
| Enterprise Value | 271,294 | |||||||||
| Net Debt | -2,890 | |||||||||
| Equity Value | 274,184 | |||||||||
| Diluted Shares Outstanding, MM | 28 | |||||||||
| Equity Value Per Share | 9,754.16 |
What You Will Receive
- Genuine Torii Data: Preloaded financials – including revenue and EBIT – derived from actual and projected figures.
- Comprehensive Customization: Modify key parameters (yellow cells) such as WACC, growth %, and tax rates.
- Real-Time Valuation Updates: Automatic recalculations to assess the influence of changes on Torii Pharmaceutical’s fair value.
- Flexible Excel Template: Designed for quick edits, scenario analysis, and in-depth projections.
- Efficient and Precise: Bypass the need to build models from the ground up while ensuring accuracy and adaptability.
Key Features
- Customizable Financial Inputs: Adjust essential variables such as revenue growth, EBITDA percentage, and capital expenditures.
- Instant DCF Valuation: Automatically computes intrinsic value, net present value, and other financial metrics.
- High-Precision Accuracy: Leverages Torii Pharmaceutical’s (4551T) actual financial data for realistic valuation results.
- Simplified Scenario Analysis: Easily examine various assumptions and compare different outcomes.
- Efficiency Booster: Streamlines the valuation process by removing the need for complex model construction.
How It Functions
- Obtain the Template: Gain immediate access to the Excel-based DCF Calculator for Torii Pharmaceutical Co., Ltd. ([4551T]).
- Enter Your Assumptions: Modify the yellow-highlighted cells to input growth rates, WACC, profit margins, and other relevant factors.
- Automatic Calculations: The model will instantly recalculate Torii’s intrinsic value based on your inputs.
- Explore Scenarios: Test various assumptions to see how they impact the potential valuation.
- Evaluate and Decide: Leverage the findings to inform your investment strategies or financial assessments.
Why Opt for This Calculator?
- Designed for Experts: A sophisticated tool utilized by market analysts, financial officers, and industry consultants.
- Comprehensive Data: Torii Pharmaceutical's historical and forecasted financials are preloaded for precision.
- Scenario Analysis: Effortlessly simulate various projections and assumptions.
- Detailed Insights: Instantly calculates intrinsic value, NPV, and essential financial metrics.
- User-Friendly: Clear, step-by-step instructions guide you throughout the entire process.
Who Can Benefit from This Product?
- Healthcare Investors: Develop comprehensive and accurate valuation models for assessing pharmaceutical investments.
- Corporate Finance Teams: Evaluate valuation scenarios to inform strategic decisions within the organization.
- Consultants and Advisors: Equip clients with precise valuation insights for Torii Pharmaceutical Co., Ltd. (4551T).
- Students and Educators: Utilize real-time data to enhance financial modeling skills and teaching methodologies.
- Pharmaceutical Enthusiasts: Gain insights into the market valuation of leading pharmaceutical companies like Torii.
Contents of the Template
- Historical Data: Features past financials and baseline forecasts for Torii Pharmaceutical Co., Ltd. (4551T).
- DCF and Levered DCF Models: Comprehensive templates designed to assess the intrinsic value of Torii Pharmaceutical Co., Ltd. (4551T).
- WACC Sheet: Standardized calculations for the Weighted Average Cost of Capital.
- Editable Inputs: Adjust essential variables such as growth rates, EBITDA percentages, and CAPEX projections.
- Quarterly and Annual Statements: A thorough analysis of the financial statements for Torii Pharmaceutical Co., Ltd. (4551T).
- Interactive Dashboard: A dynamic visual representation of valuation outcomes and future projections.
Disclaimer
All information, articles, and product details provided on this website are for general informational and educational purposes only. We do not claim any ownership over, nor do we intend to infringe upon, any trademarks, copyrights, logos, brand names, or other intellectual property mentioned or depicted on this site. Such intellectual property remains the property of its respective owners, and any references here are made solely for identification or informational purposes, without implying any affiliation, endorsement, or partnership.
We make no representations or warranties, express or implied, regarding the accuracy, completeness, or suitability of any content or products presented. Nothing on this website should be construed as legal, tax, investment, financial, medical, or other professional advice. In addition, no part of this site—including articles or product references—constitutes a solicitation, recommendation, endorsement, advertisement, or offer to buy or sell any securities, franchises, or other financial instruments, particularly in jurisdictions where such activity would be unlawful.
All content is of a general nature and may not address the specific circumstances of any individual or entity. It is not a substitute for professional advice or services. Any actions you take based on the information provided here are strictly at your own risk. You accept full responsibility for any decisions or outcomes arising from your use of this website and agree to release us from any liability in connection with your use of, or reliance upon, the content or products found herein.