
|
Toyo Ink SC Holdings Co., Ltd. (4634.t) DCF -Bewertung |
Fully Editable: Tailor To Your Needs In Excel Or Sheets
Professional Design: Trusted, Industry-Standard Templates
Investor-Approved Valuation Models
MAC/PC Compatible, Fully Unlocked
No Expertise Is Needed; Easy To Follow
Toyo Ink SC Holdings Co., Ltd. (4634.T) Bundle
Verbessern Sie Ihre Anlagestrategien mit dem DCF -Taschenrechner (4634T)! Tauchen Sie in authentische Toyo Ink SC Holdings Co., Ltd. Financials, stellen Sie Wachstumsprojektionen und -kosten an und beobachten Sie sofort, wie sich Modifikationen auf den inneren Wert von (4634T) auswirken.
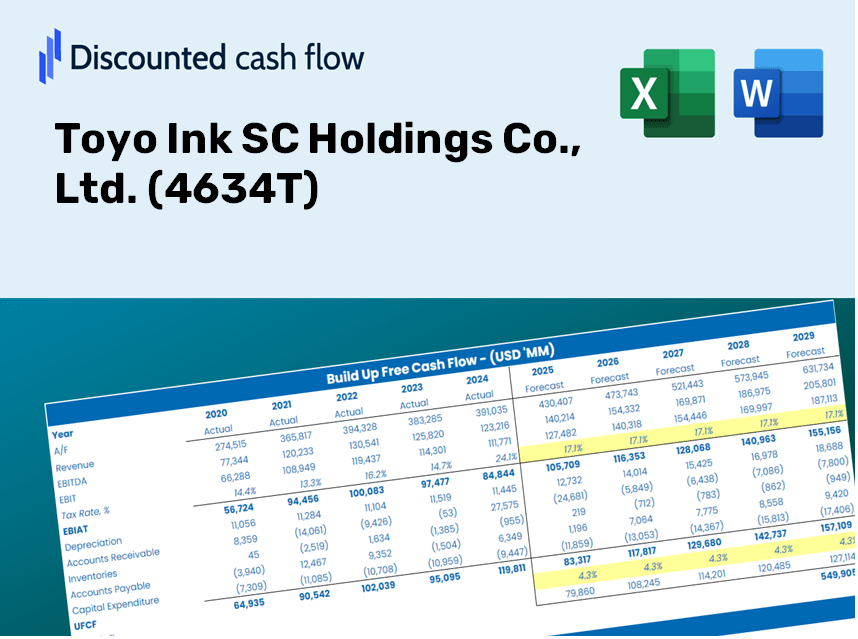
Discounted Cash Flow (DCF) - (USD MM)
| Year | AY1 2020 |
AY2 2021 |
AY3 2022 |
AY4 2023 |
AY5 2024 |
FY1 2025 |
FY2 2026 |
FY3 2027 |
FY4 2028 |
FY5 2029 |
|---|---|---|---|---|---|---|---|---|---|---|
| Revenue | 257,675.0 | 287,989.0 | 315,927.0 | 322,122.0 | 351,064.0 | 379,510.0 | 410,260.9 | 443,503.5 | 479,439.7 | 518,287.8 |
| Revenue Growth, % | 0 | 11.76 | 9.7 | 1.96 | 8.98 | 8.1 | 8.1 | 8.1 | 8.1 | 8.1 |
| EBITDA | 19,706.0 | 23,405.0 | 24,472.0 | 26,101.0 | 37,751.0 | 32,164.9 | 34,771.2 | 37,588.6 | 40,634.3 | 43,926.9 |
| EBITDA, % | 7.65 | 8.13 | 7.75 | 8.1 | 10.75 | 8.48 | 8.48 | 8.48 | 8.48 | 8.48 |
| Depreciation | 9,187.0 | 9,731.0 | 10,747.0 | 11,339.0 | 12,083.0 | 13,137.1 | 14,201.5 | 15,352.3 | 16,596.2 | 17,941.0 |
| Depreciation, % | 3.57 | 3.38 | 3.4 | 3.52 | 3.44 | 3.46 | 3.46 | 3.46 | 3.46 | 3.46 |
| EBIT | 10,519.0 | 13,674.0 | 13,725.0 | 14,762.0 | 25,668.0 | 19,027.8 | 20,569.6 | 22,236.3 | 24,038.1 | 25,985.9 |
| EBIT, % | 4.08 | 4.75 | 4.34 | 4.58 | 7.31 | 5.01 | 5.01 | 5.01 | 5.01 | 5.01 |
| Total Cash | 76,526.0 | 64,840.0 | 55,547.0 | 57,982.0 | 62,954.0 | 80,249.7 | 86,752.1 | 93,781.5 | 101,380.4 | 109,595.0 |
| Total Cash, percent | .0 | .0 | .0 | .0 | .0 | .0 | .0 | .0 | .0 | .0 |
| Account Receivables | 86,202.0 | 93,197.0 | 99,236.0 | 101,986.0 | 108,258.0 | 121,233.6 | 131,057.0 | 141,676.2 | 153,156.0 | 165,565.9 |
| Account Receivables, % | 33.45 | 32.36 | 31.41 | 31.66 | 30.84 | 31.94 | 31.94 | 31.94 | 31.94 | 31.94 |
| Inventories | 46,188.0 | 59,570.0 | 67,582.0 | 64,718.0 | 68,234.0 | 75,544.4 | 81,665.6 | 88,282.8 | 95,436.2 | 103,169.2 |
| Inventories, % | 17.92 | 20.68 | 21.39 | 20.09 | 19.44 | 19.91 | 19.91 | 19.91 | 19.91 | 19.91 |
| Accounts Payable | 54,608.0 | 68,221.0 | 70,738.0 | 67,075.0 | 70,747.0 | 82,161.6 | 88,819.0 | 96,015.8 | 103,795.8 | 112,206.2 |
| Accounts Payable, % | 21.19 | 23.69 | 22.39 | 20.82 | 20.15 | 21.65 | 21.65 | 21.65 | 21.65 | 21.65 |
| Capital Expenditure | -13,160.0 | -18,110.0 | -17,945.0 | -20,006.0 | -18,033.0 | -21,573.7 | -23,321.8 | -25,211.5 | -27,254.3 | -29,462.7 |
| Capital Expenditure, % | -5.11 | -6.29 | -5.68 | -6.21 | -5.14 | -5.68 | -5.68 | -5.68 | -5.68 | -5.68 |
| Tax Rate, % | 19.05 | 19.05 | 19.05 | 19.05 | 19.05 | 19.05 | 19.05 | 19.05 | 19.05 | 19.05 |
| EBITAT | 6,332.0 | 9,885.3 | 10,335.9 | 11,216.4 | 20,777.4 | 13,879.8 | 15,004.5 | 16,220.2 | 17,534.5 | 18,955.3 |
| Depreciation | ||||||||||
| Changes in Account Receivables | ||||||||||
| Changes in Inventories | ||||||||||
| Changes in Accounts Payable | ||||||||||
| Capital Expenditure | ||||||||||
| UFCF | -75,423.0 | -5,257.7 | -8,396.1 | -999.6 | 8,711.4 | -3,428.3 | -3,402.9 | -3,678.6 | -3,976.7 | -4,298.9 |
| WACC, % | 3.75 | 3.89 | 3.93 | 3.94 | 4 | 3.9 | 3.9 | 3.9 | 3.9 | 3.9 |
| PV UFCF | ||||||||||
| SUM PV UFCF | -16,693.2 | |||||||||
| Long Term Growth Rate, % | 2.00 | |||||||||
| Free cash flow (T + 1) | -4,385 | |||||||||
| Terminal Value | -230,481 | |||||||||
| Present Terminal Value | -190,329 | |||||||||
| Enterprise Value | -207,022 | |||||||||
| Net Debt | 17,884 | |||||||||
| Equity Value | -224,906 | |||||||||
| Diluted Shares Outstanding, MM | 53 | |||||||||
| Equity Value Per Share | -4,275.04 |
What You Will Receive
- Pre-Filled Financial Model: Utilize Toyo Ink's actual data for accurate DCF valuation.
- Comprehensive Forecast Control: Modify revenue growth, profit margins, WACC, and other crucial metrics.
- Real-Time Calculations: Automatic updates provide immediate feedback as you make adjustments.
- Professional-Grade Template: An expertly designed Excel file ready for investor presentations.
- Customizable and Reusable: Designed for adaptability, perfect for repeated use in detailed forecasting.
Key Features
- Authentic Toyo Ink Financials: Obtain precise historical data and future forecasts tailored for Toyo Ink SC Holdings Co., Ltd. (4634T).
- Tailorable Forecast Inputs: Modify the highlighted cells for key parameters such as WACC, growth rates, and profit margins.
- Adaptive Calculations: Real-time updates for DCF, Net Present Value (NPV), and cash flow assessments.
- Interactive Dashboard: User-friendly charts and summaries that effectively present your valuation outcomes.
- Suitable for All Skill Levels: Designed with an intuitive layout for investors, CFOs, and consultants alike.
How It Works
- Step 1: Download the Excel file for Toyo Ink SC Holdings Co., Ltd. (4634T).
- Step 2: Review Toyo Ink's pre-filled financial data and forecasts.
- Step 3: Adjust key inputs such as revenue growth, WACC, and tax rates (cells highlighted for easy identification).
- Step 4: Observe the DCF model refresh in real-time as you modify your assumptions.
- Step 5: Evaluate the outputs and leverage the results for your investment strategies.
Why Choose This Calculator for Toyo Ink SC Holdings Co., Ltd. (4634T)?
- Comprehensive Tool: Offers DCF, WACC, and financial ratio analyses all in one convenient package.
- Customizable Inputs: Modify the yellow-highlighted cells to explore different financial scenarios.
- Detailed Insights: Automatically computes Toyo Ink's intrinsic value and Net Present Value.
- Preloaded Data: Historical and projected data provide reliable starting points for analysis.
- Professional Quality: Perfect for financial analysts, investors, and business consultants focused on Toyo Ink's performance.
Who Should Use This Product?
- Individual Investors: Gain insights to make informed decisions about buying or selling Toyo Ink SC Holdings Co., Ltd. (4634T) shares.
- Financial Analysts: Enhance your valuation processes with comprehensive financial models tailored for Toyo Ink SC Holdings Co., Ltd. (4634T).
- Consultants: Provide your clients with accurate and timely valuation analysis for Toyo Ink SC Holdings Co., Ltd. (4634T).
- Business Owners: Learn how large corporations like Toyo Ink SC Holdings Co., Ltd. (4634T) are valued to inform your own business strategies.
- Finance Students: Develop your understanding of valuation methods using real data and case studies from Toyo Ink SC Holdings Co., Ltd. (4634T).
Contents of the Template
- Preloaded Toyo Ink Data: Historical and projected financial information, including revenue, EBIT, and capital expenditures.
- DCF and WACC Models: Advanced sheets designed to calculate intrinsic value and Weighted Average Cost of Capital.
- Editable Inputs: Yellow-highlighted cells for modifying revenue growth, tax rates, and discount rates.
- Financial Statements: Detailed annual and quarterly financials for in-depth analysis.
- Key Ratios: Profitability, leverage, and efficiency ratios for performance evaluation.
- Dashboard and Charts: Visual representations of valuation results and underlying assumptions.
Disclaimer
All information, articles, and product details provided on this website are for general informational and educational purposes only. We do not claim any ownership over, nor do we intend to infringe upon, any trademarks, copyrights, logos, brand names, or other intellectual property mentioned or depicted on this site. Such intellectual property remains the property of its respective owners, and any references here are made solely for identification or informational purposes, without implying any affiliation, endorsement, or partnership.
We make no representations or warranties, express or implied, regarding the accuracy, completeness, or suitability of any content or products presented. Nothing on this website should be construed as legal, tax, investment, financial, medical, or other professional advice. In addition, no part of this site—including articles or product references—constitutes a solicitation, recommendation, endorsement, advertisement, or offer to buy or sell any securities, franchises, or other financial instruments, particularly in jurisdictions where such activity would be unlawful.
All content is of a general nature and may not address the specific circumstances of any individual or entity. It is not a substitute for professional advice or services. Any actions you take based on the information provided here are strictly at your own risk. You accept full responsibility for any decisions or outcomes arising from your use of this website and agree to release us from any liability in connection with your use of, or reliance upon, the content or products found herein.