
|
Fuji Media Holdings, Inc. (4676.t) DCF -Bewertung |
Fully Editable: Tailor To Your Needs In Excel Or Sheets
Professional Design: Trusted, Industry-Standard Templates
Investor-Approved Valuation Models
MAC/PC Compatible, Fully Unlocked
No Expertise Is Needed; Easy To Follow
Fuji Media Holdings, Inc. (4676.T) Bundle
Bewerten Sie Fuji Media Holdings, Inc. (4676t) finanzielle Aussichten wie ein Experte! Dieser (4676T) DCF-Taschenrechner bietet vorgefüllte Finanzdaten und vollständige Flexibilität, um das Umsatzwachstum, WACC, Margen und andere wichtige Annahmen zu ändern, um sich an Ihren Projektionen anzupassen.
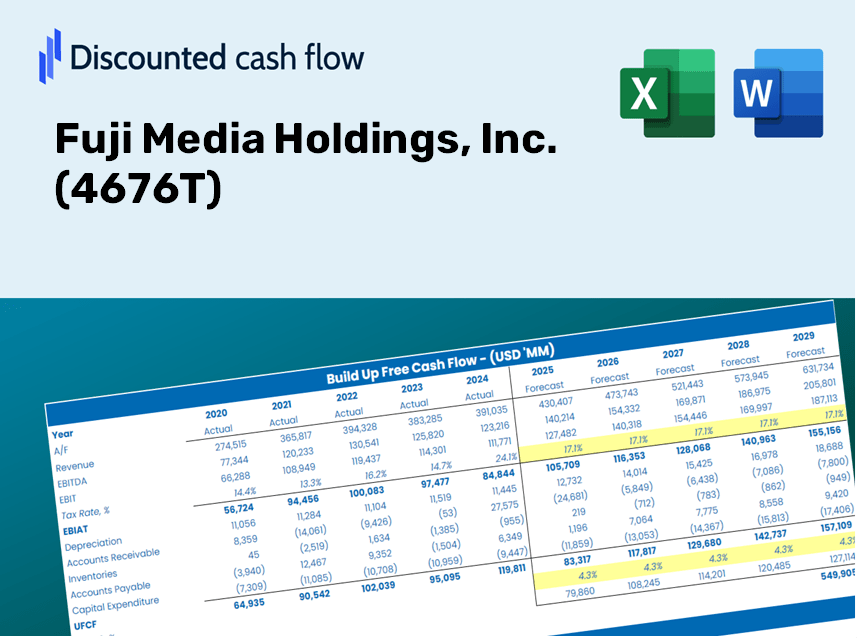
Discounted Cash Flow (DCF) - (USD MM)
| Year | AY1 2021 |
AY2 2022 |
AY3 2023 |
AY4 2024 |
AY5 2025 |
FY1 2026 |
FY2 2027 |
FY3 2028 |
FY4 2029 |
FY5 2030 |
|---|---|---|---|---|---|---|---|---|---|---|
| Revenue | 519,941.0 | 525,087.0 | 535,641.0 | 566,443.0 | 550,761.0 | 558,997.2 | 567,356.5 | 575,840.9 | 584,452.1 | 593,192.1 |
| Revenue Growth, % | 0 | 0.98973 | 2.01 | 5.75 | -2.77 | 1.5 | 1.5 | 1.5 | 1.5 | 1.5 |
| EBITDA | 40,500.0 | 54,363.0 | 84,077.0 | 74,244.0 | 22,486.0 | 57,049.9 | 57,903.0 | 58,768.9 | 59,647.8 | 60,539.7 |
| EBITDA, % | 7.79 | 10.35 | 15.7 | 13.11 | 4.08 | 10.21 | 10.21 | 10.21 | 10.21 | 10.21 |
| Depreciation | 17,794.0 | 18,255.0 | 17,859.0 | 17,968.0 | 19,962.0 | 19,038.9 | 19,323.6 | 19,612.6 | 19,905.9 | 20,203.6 |
| Depreciation, % | 3.42 | 3.48 | 3.33 | 3.17 | 3.62 | 3.41 | 3.41 | 3.41 | 3.41 | 3.41 |
| EBIT | 22,706.0 | 36,108.0 | 66,218.0 | 56,276.0 | 2,524.0 | 38,011.0 | 38,579.4 | 39,156.3 | 39,741.9 | 40,336.2 |
| EBIT, % | 4.37 | 6.88 | 12.36 | 9.93 | 0.45828 | 6.8 | 6.8 | 6.8 | 6.8 | 6.8 |
| Total Cash | 193,657.0 | 196,151.0 | 209,713.0 | 197,538.0 | 198,288.0 | 206,414.9 | 209,501.6 | 212,634.5 | 215,814.3 | 219,041.6 |
| Total Cash, percent | .0 | .0 | .0 | .0 | .0 | .0 | .0 | .0 | .0 | .0 |
| Account Receivables | 90,591.0 | 93,040.0 | 95,377.0 | 95,155.0 | 69,409.0 | 92,066.3 | 93,443.1 | 94,840.4 | 96,258.7 | 97,698.1 |
| Account Receivables, % | 17.42 | 17.72 | 17.81 | 16.8 | 12.6 | 16.47 | 16.47 | 16.47 | 16.47 | 16.47 |
| Inventories | 89,841.0 | 65,807.0 | 72,436.0 | 73,553.0 | 82,864.0 | 79,786.0 | 80,979.2 | 82,190.2 | 83,419.2 | 84,666.7 |
| Inventories, % | 17.28 | 12.53 | 13.52 | 12.99 | 15.05 | 14.27 | 14.27 | 14.27 | 14.27 | 14.27 |
| Accounts Payable | 34,803.0 | 32,855.0 | 39,040.0 | 45,567.0 | 46,854.0 | 41,131.8 | 41,746.9 | 42,371.2 | 43,004.8 | 43,647.9 |
| Accounts Payable, % | 6.69 | 6.26 | 7.29 | 8.04 | 8.51 | 7.36 | 7.36 | 7.36 | 7.36 | 7.36 |
| Capital Expenditure | -47,065.0 | -40,346.0 | -51,970.0 | -109,317.0 | -61,245.0 | -63,565.8 | -64,516.4 | -65,481.1 | -66,460.4 | -67,454.2 |
| Capital Expenditure, % | -9.05 | -7.68 | -9.7 | -19.3 | -11.12 | -11.37 | -11.37 | -11.37 | -11.37 | -11.37 |
| Tax Rate, % | -15628.91 | -15628.91 | -15628.91 | -15628.91 | -15628.91 | -15628.91 | -15628.91 | -15628.91 | -15628.91 | -15628.91 |
| EBITAT | 10,795.7 | 25,940.1 | 47,923.2 | 38,360.1 | 396,997.6 | 27,362.0 | 27,771.1 | 28,186.4 | 28,607.9 | 29,035.7 |
| Depreciation | ||||||||||
| Changes in Account Receivables | ||||||||||
| Changes in Inventories | ||||||||||
| Changes in Accounts Payable | ||||||||||
| Capital Expenditure | ||||||||||
| UFCF | -164,104.3 | 23,486.1 | 11,031.2 | -47,356.9 | 373,436.6 | -42,466.4 | -19,376.4 | -19,666.2 | -19,960.3 | -20,258.7 |
| WACC, % | 3.91 | 4.21 | 4.22 | 4.17 | 4.56 | 4.21 | 4.21 | 4.21 | 4.21 | 4.21 |
| PV UFCF | ||||||||||
| SUM PV UFCF | -109,368.2 | |||||||||
| Long Term Growth Rate, % | 2.00 | |||||||||
| Free cash flow (T + 1) | -20,664 | |||||||||
| Terminal Value | -933,151 | |||||||||
| Present Terminal Value | -759,124 | |||||||||
| Enterprise Value | -868,492 | |||||||||
| Net Debt | 266,597 | |||||||||
| Equity Value | -1,135,089 | |||||||||
| Diluted Shares Outstanding, MM | 210 | |||||||||
| Equity Value Per Share | -5,397.58 |
What You Will Receive
- Flexible Forecast Inputs: Modify key assumptions (growth %, margins, WACC) seamlessly to explore various scenarios.
- Comprehensive Data: Fuji Media Holdings, Inc. (4676T) financial data pre-loaded to facilitate your analysis.
- Automated DCF Outputs: The template computes Net Present Value (NPV) and intrinsic value automatically.
- Tailorable and Professional: A refined Excel model that aligns with your valuation requirements.
- Designed for Analysts and Investors: Perfect for evaluating projections, confirming strategies, and increasing efficiency.
Key Features
- 🔍 Real-Life (4676T) Financials: Pre-filled historical and projected data for Fuji Media Holdings, Inc.
- ✏️ Fully Customizable Inputs: Modify all essential parameters (yellow cells) such as WACC, growth %, and tax rates.
- 📊 Professional DCF Valuation: Integrated formulas determine Fuji Media's intrinsic value through the Discounted Cash Flow method.
- ⚡ Instant Results: See Fuji Media's valuation immediately upon making adjustments.
- Scenario Analysis: Evaluate and compare results for different financial assumptions side-by-side.
How It Functions
- Step 1: Download the ready-to-use Excel template featuring Fuji Media Holdings, Inc.'s (4676T) data.
- Step 2: Navigate through the pre-filled worksheets to familiarize yourself with the essential metrics.
- Step 3: Revise forecasts and assumptions in the editable yellow cells (WACC, growth, margins).
- Step 4: View updated results in real-time, including the intrinsic value of Fuji Media Holdings, Inc. (4676T).
- Step 5: Utilize the outputs to make informed investment choices or create reports.
Why Choose This Calculator for Fuji Media Holdings, Inc. (4676T)?
- All-in-One Solution: Features DCF, WACC, and comprehensive financial ratio analysis in a single tool.
- Adjustable Variables: Modify the yellow-highlighted cells to explore different financial scenarios.
- In-Depth Analysis: Automatically determines the intrinsic value and Net Present Value for Fuji Media Holdings, Inc. (4676T).
- Loaded with Data: Contains both historical and projected data for precise calculations.
- High-Caliber Resource: Perfect for financial analysts, investors, and business advisors.
Who Can Benefit from This Product?
- Investors: Evaluate Fuji Media Holdings, Inc.'s (4676T) valuation before making stock transactions.
- CFOs and Financial Analysts: Optimize valuation processes and assess financial forecasts for accuracy.
- Startup Founders: Discover how prominent companies like Fuji Media Holdings, Inc. (4676T) are appraised in the market.
- Consultants: Create comprehensive valuation reports tailored for client needs.
- Students and Educators: Utilize real market data to enhance learning and demonstrate valuation methods.
Contents of the Template
- Pre-Filled DCF Model: Fuji Media Holdings, Inc.’s financial data preloaded for immediate application.
- WACC Calculator: Comprehensive calculations for the Weighted Average Cost of Capital.
- Financial Ratios: Analyze Fuji Media’s profitability, leverage, and operational efficiency.
- Editable Inputs: Adjust assumptions like growth rates, margins, and CAPEX to suit your scenarios.
- Financial Statements: Access annual and quarterly reports for in-depth analysis.
- Interactive Dashboard: Effortlessly visualize key valuation metrics and outcomes.
Disclaimer
All information, articles, and product details provided on this website are for general informational and educational purposes only. We do not claim any ownership over, nor do we intend to infringe upon, any trademarks, copyrights, logos, brand names, or other intellectual property mentioned or depicted on this site. Such intellectual property remains the property of its respective owners, and any references here are made solely for identification or informational purposes, without implying any affiliation, endorsement, or partnership.
We make no representations or warranties, express or implied, regarding the accuracy, completeness, or suitability of any content or products presented. Nothing on this website should be construed as legal, tax, investment, financial, medical, or other professional advice. In addition, no part of this site—including articles or product references—constitutes a solicitation, recommendation, endorsement, advertisement, or offer to buy or sell any securities, franchises, or other financial instruments, particularly in jurisdictions where such activity would be unlawful.
All content is of a general nature and may not address the specific circumstances of any individual or entity. It is not a substitute for professional advice or services. Any actions you take based on the information provided here are strictly at your own risk. You accept full responsibility for any decisions or outcomes arising from your use of this website and agree to release us from any liability in connection with your use of, or reliance upon, the content or products found herein.