
|
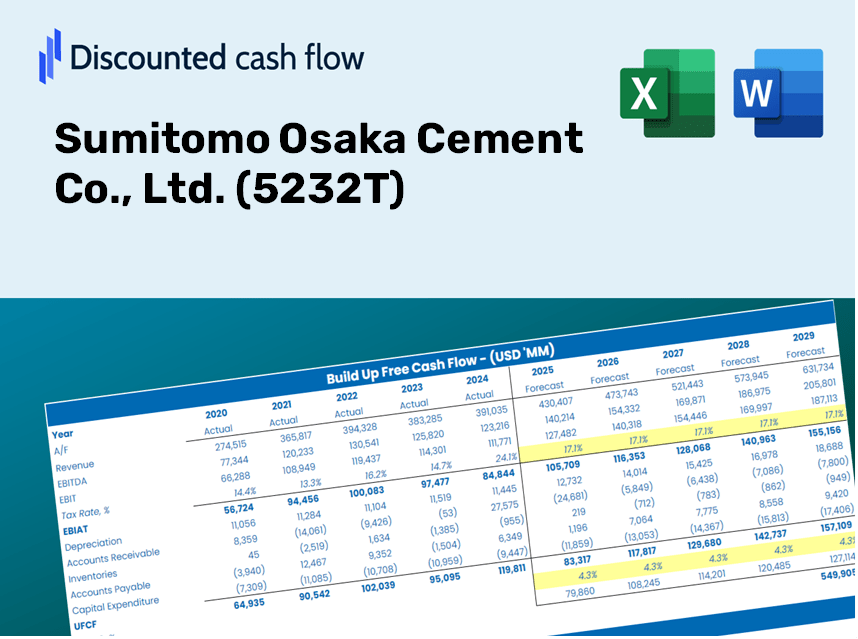
Sumitomo Osaka Cement Co., Ltd. (5232.t) DCF -Bewertung |
Fully Editable: Tailor To Your Needs In Excel Or Sheets
Professional Design: Trusted, Industry-Standard Templates
Investor-Approved Valuation Models
MAC/PC Compatible, Fully Unlocked
No Expertise Is Needed; Easy To Follow
Sumitomo Osaka Cement Co., Ltd. (5232.T) Bundle
Bewerten Sie die finanziellen Aussichten von Sumitomo Osaka Cement Co., Ltd. wie ein Experte! Dieser (5232T) DCF-Taschenrechner bietet Ihnen vorgefüllte Finanzdaten und die Möglichkeit, das Umsatzwachstum, WACC, Margen und andere wesentliche Annahmen anzupassen, um sich an Ihren Projektionen anzupassen.
Discounted Cash Flow (DCF) - (USD MM)
| Year | AY1 2021 |
AY2 2022 |
AY3 2023 |
AY4 2024 |
AY5 2025 |
FY1 2026 |
FY2 2027 |
FY3 2028 |
FY4 2029 |
FY5 2030 |
|---|---|---|---|---|---|---|---|---|---|---|
| Revenue | 239,274.0 | 184,209.0 | 204,705.0 | 222,502.0 | 219,465.0 | 216,964.3 | 214,492.1 | 212,048.0 | 209,631.8 | 207,243.2 |
| Revenue Growth, % | 0 | -23.01 | 11.13 | 8.69 | -1.36 | -1.14 | -1.14 | -1.14 | -1.14 | -1.14 |
| EBITDA | 36,403.0 | 31,957.0 | 17,920.0 | 41,215.0 | 36,407.0 | 33,164.6 | 32,786.7 | 32,413.1 | 32,043.7 | 31,678.6 |
| EBITDA, % | 15.21 | 17.35 | 8.75 | 18.52 | 16.59 | 15.29 | 15.29 | 15.29 | 15.29 | 15.29 |
| Depreciation | 18,766.0 | 19,367.0 | 20,245.0 | 21,691.0 | 22,604.0 | 20,956.4 | 20,717.6 | 20,481.6 | 20,248.2 | 20,017.5 |
| Depreciation, % | 7.84 | 10.51 | 9.89 | 9.75 | 10.3 | 9.66 | 9.66 | 9.66 | 9.66 | 9.66 |
| EBIT | 17,637.0 | 12,590.0 | -2,325.0 | 19,524.0 | 13,803.0 | 12,208.2 | 12,069.1 | 11,931.5 | 11,795.6 | 11,661.2 |
| EBIT, % | 7.37 | 6.83 | -1.14 | 8.77 | 6.29 | 5.63 | 5.63 | 5.63 | 5.63 | 5.63 |
| Total Cash | 18,664.0 | 13,148.0 | 14,542.0 | 18,724.0 | 16,554.0 | 16,489.2 | 16,301.3 | 16,115.6 | 15,931.9 | 15,750.4 |
| Total Cash, percent | .0 | .0 | .0 | .0 | .0 | .0 | .0 | .0 | .0 | .0 |
| Account Receivables | 48,906.0 | 46,330.0 | 50,278.0 | 52,505.0 | 49,242.0 | 50,416.5 | 49,842.0 | 49,274.1 | 48,712.6 | 48,157.6 |
| Account Receivables, % | 20.44 | 25.15 | 24.56 | 23.6 | 22.44 | 23.24 | 23.24 | 23.24 | 23.24 | 23.24 |
| Inventories | 21,743.0 | 25,259.0 | 48,107.0 | 35,586.0 | 34,793.0 | 33,910.2 | 33,523.8 | 33,141.8 | 32,764.2 | 32,390.9 |
| Inventories, % | 9.09 | 13.71 | 23.5 | 15.99 | 15.85 | 15.63 | 15.63 | 15.63 | 15.63 | 15.63 |
| Accounts Payable | 28,132.0 | 30,051.0 | 29,676.0 | 33,629.0 | 30,622.0 | 31,084.4 | 30,730.2 | 30,380.0 | 30,033.9 | 29,691.6 |
| Accounts Payable, % | 11.76 | 16.31 | 14.5 | 15.11 | 13.95 | 14.33 | 14.33 | 14.33 | 14.33 | 14.33 |
| Capital Expenditure | -20,221.0 | -20,921.0 | -27,913.0 | -28,882.0 | -27,645.0 | -25,610.9 | -25,319.1 | -25,030.6 | -24,745.4 | -24,463.4 |
| Capital Expenditure, % | -8.45 | -11.36 | -13.64 | -12.98 | -12.6 | -11.8 | -11.8 | -11.8 | -11.8 | -11.8 |
| Tax Rate, % | 29.48 | 29.48 | 29.48 | 29.48 | 29.48 | 29.48 | 29.48 | 29.48 | 29.48 | 29.48 |
| EBITAT | 12,141.7 | 10,138.7 | -4,274.1 | 16,072.5 | 9,734.4 | 9,820.7 | 9,708.8 | 9,598.1 | 9,488.8 | 9,380.6 |
| Depreciation | ||||||||||
| Changes in Account Receivables | ||||||||||
| Changes in Inventories | ||||||||||
| Changes in Accounts Payable | ||||||||||
| Capital Expenditure | ||||||||||
| UFCF | -31,830.3 | 9,563.7 | -39,113.1 | 23,128.5 | 5,742.4 | 5,336.8 | 5,714.0 | 5,648.9 | 5,584.5 | 5,520.9 |
| WACC, % | 3.83 | 4 | 4.29 | 4.03 | 3.86 | 4 | 4 | 4 | 4 | 4 |
| PV UFCF | ||||||||||
| SUM PV UFCF | 24,745.1 | |||||||||
| Long Term Growth Rate, % | 2.00 | |||||||||
| Free cash flow (T + 1) | 5,631 | |||||||||
| Terminal Value | 281,049 | |||||||||
| Present Terminal Value | 230,961 | |||||||||
| Enterprise Value | 255,706 | |||||||||
| Net Debt | 66,779 | |||||||||
| Equity Value | 188,927 | |||||||||
| Diluted Shares Outstanding, MM | 33 | |||||||||
| Equity Value Per Share | 5,670.43 |
What You Will Receive
- Accurate 5232T Financial Data: Access to both historical and projected figures for precise valuations.
- Customizable Inputs: Adjust parameters such as WACC, tax rates, revenue growth, and capital investments.
- Real-Time Calculations: Intrinsic value and NPV are computed instantly.
- Comprehensive Scenario Analysis: Explore various scenarios to assess the future potential of Sumitomo Osaka Cement.
- User-Friendly Design: Designed for industry professionals while remaining easy for novices to navigate.
Key Features
- Comprehensive DCF Calculator: Features detailed unlevered and levered DCF valuation models tailored for Sumitomo Osaka Cement Co., Ltd. (5232T).
- WACC Calculator: Equipped with a pre-constructed Weighted Average Cost of Capital template that allows for adjustable inputs.
- Customizable Forecast Assumptions: Alter growth rates, capital expenditures, and discount rates according to your analysis.
- Integrated Financial Ratios: Evaluate profitability, leverage, and efficiency ratios specifically for Sumitomo Osaka Cement Co., Ltd. (5232T).
- Intuitive Dashboard and Charts: Visual representations summarize essential valuation metrics for straightforward analysis.
How It Functions
- Download: Obtain the comprehensive Excel file containing Sumitomo Osaka Cement Co., Ltd.’s (5232T) financial data.
- Customize: Tailor your assumptions, such as revenue growth rates, EBITDA percentages, and WACC.
- Update Instantly: Watch as the intrinsic value and NPV calculations refresh in real-time.
- Analyze Scenarios: Generate various projections and effortlessly compare the results.
- Make Informed Choices: Leverage the valuation insights to enhance your investment strategy.
Why Opt for This Calculator?
- All-in-One Solution: Features DCF, WACC, and financial ratio analyses tailored for Sumitomo Osaka Cement Co., Ltd. (5232T).
- Flexible Inputs: Modify the highlighted cells to explore different financial scenarios.
- In-Depth Analysis: Automatically computes the intrinsic value and Net Present Value for Sumitomo Osaka Cement Co., Ltd. (5232T).
- Built-In Data: Historical and projected data provide reliable starting points for evaluation.
- Expert-Level Quality: Perfect for financial analysts, investors, and business advisors focused on Sumitomo Osaka Cement Co., Ltd. (5232T).
Who Can Benefit from This Product?
- Finance Students: Acquire skills in valuation methods and practice with real market data.
- Academics: Integrate advanced financial models into your research or teaching materials.
- Investors: Evaluate your investment hypotheses and explore valuation results for Sumitomo Osaka Cement Co., Ltd. (5232T).
- Analysts: Enhance your efficiency with a customizable, ready-to-use DCF model.
- Small Business Owners: Discover how major corporations like Sumitomo Osaka Cement (5232T) are assessed financially.
Contents of the Template
- Historical Data: A compilation of Sumitomo Osaka Cement's past financial performances and baseline forecasts.
- DCF and Levered DCF Models: Comprehensive templates designed to assess the intrinsic value of Sumitomo Osaka Cement (5232T).
- WACC Sheet: Ready-to-use calculations for the Weighted Average Cost of Capital.
- Editable Inputs: Adjust critical parameters such as growth rates, EBITDA percentages, and capital expenditure assumptions.
- Quarterly and Annual Statements: An extensive overview of Sumitomo Osaka Cement's financial statements.
- Interactive Dashboard: A dynamic interface to visualize valuation outcomes and forecasts.
Disclaimer
All information, articles, and product details provided on this website are for general informational and educational purposes only. We do not claim any ownership over, nor do we intend to infringe upon, any trademarks, copyrights, logos, brand names, or other intellectual property mentioned or depicted on this site. Such intellectual property remains the property of its respective owners, and any references here are made solely for identification or informational purposes, without implying any affiliation, endorsement, or partnership.
We make no representations or warranties, express or implied, regarding the accuracy, completeness, or suitability of any content or products presented. Nothing on this website should be construed as legal, tax, investment, financial, medical, or other professional advice. In addition, no part of this site—including articles or product references—constitutes a solicitation, recommendation, endorsement, advertisement, or offer to buy or sell any securities, franchises, or other financial instruments, particularly in jurisdictions where such activity would be unlawful.
All content is of a general nature and may not address the specific circumstances of any individual or entity. It is not a substitute for professional advice or services. Any actions you take based on the information provided here are strictly at your own risk. You accept full responsibility for any decisions or outcomes arising from your use of this website and agree to release us from any liability in connection with your use of, or reliance upon, the content or products found herein.