
|
JFE Holdings, Inc. (5411.t) DCF -Bewertung |
Fully Editable: Tailor To Your Needs In Excel Or Sheets
Professional Design: Trusted, Industry-Standard Templates
Investor-Approved Valuation Models
MAC/PC Compatible, Fully Unlocked
No Expertise Is Needed; Easy To Follow
JFE Holdings, Inc. (5411.T) Bundle
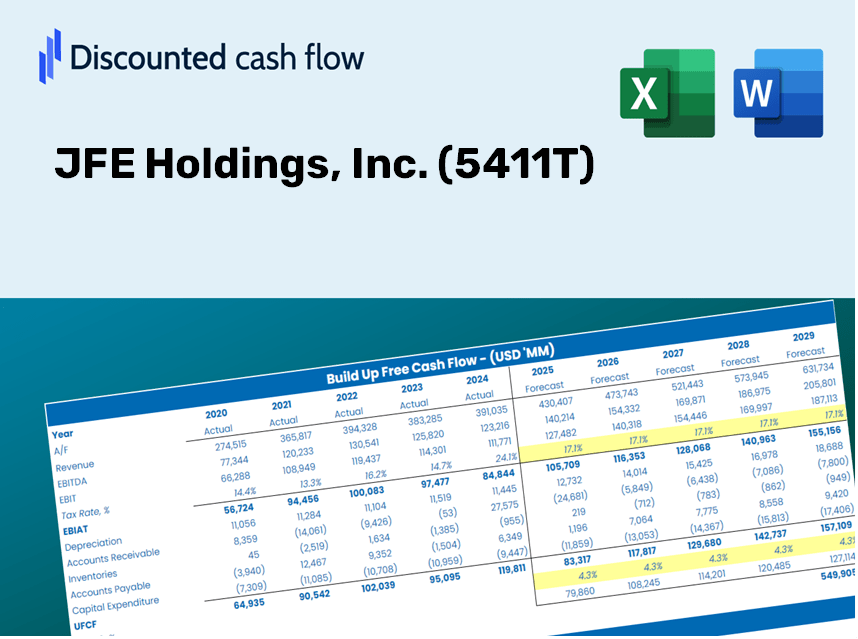
Gewinnen Sie einen Einblick in Ihre Bewertungsanalyse für JFE Holdings, Inc. (5411t) mit unserem ausgeklügelten DCF -Taschenrechner! Diese Excel -Vorlage wird mit tatsächlichen (5411t) Daten vorinstalliert, sodass Sie Prognosen und Annahmen anpassen können, um den inneren Wert von JFE Holdings, Inc. genau zu bestimmen.
Discounted Cash Flow (DCF) - (USD MM)
| Year | AY1 2021 |
AY2 2022 |
AY3 2023 |
AY4 2024 |
AY5 2025 |
FY1 2026 |
FY2 2027 |
FY3 2028 |
FY4 2029 |
FY5 2030 |
|---|---|---|---|---|---|---|---|---|---|---|
| Revenue | 3,227,285.0 | 4,365,145.0 | 5,268,794.0 | 5,174,632.0 | 4,859,647.0 | 5,443,833.7 | 6,098,246.5 | 6,831,327.4 | 7,652,533.3 | 8,572,457.7 |
| Revenue Growth, % | 0 | 35.26 | 20.7 | -1.79 | -6.09 | 12.02 | 12.02 | 12.02 | 12.02 | 12.02 |
| EBITDA | 231,367.0 | 554,294.0 | 475,362.0 | 566,152.0 | 399,287.0 | 523,117.4 | 586,002.2 | 656,446.6 | 735,359.2 | 823,758.0 |
| EBITDA, % | 7.17 | 12.7 | 9.02 | 10.94 | 8.22 | 9.61 | 9.61 | 9.61 | 9.61 | 9.61 |
| Depreciation | 236,353.0 | 252,283.0 | 269,600.0 | 274,101.0 | 257,638.0 | 313,767.2 | 351,485.7 | 393,738.4 | 441,070.4 | 494,092.2 |
| Depreciation, % | 7.32 | 5.78 | 5.12 | 5.3 | 5.3 | 5.76 | 5.76 | 5.76 | 5.76 | 5.76 |
| EBIT | -4,986.0 | 302,011.0 | 205,762.0 | 292,051.0 | 141,649.0 | 209,350.2 | 234,516.5 | 262,708.2 | 294,288.8 | 329,665.7 |
| EBIT, % | -0.1545 | 6.92 | 3.91 | 5.64 | 2.91 | 3.85 | 3.85 | 3.85 | 3.85 | 3.85 |
| Total Cash | 142,416.0 | 101,773.0 | 119,391.0 | 243,079.0 | 172,841.0 | 187,970.5 | 210,566.8 | 235,879.4 | 264,234.9 | 295,999.0 |
| Total Cash, percent | .0 | .0 | .0 | .0 | .0 | .0 | .0 | .0 | .0 | .0 |
| Account Receivables | 751,824.0 | 921,853.0 | 776,115.0 | 762,428.0 | 854,499.0 | 995,811.0 | 1,115,519.2 | 1,249,617.7 | 1,399,836.4 | 1,568,113.2 |
| Account Receivables, % | 23.3 | 21.12 | 14.73 | 14.73 | 17.58 | 18.29 | 18.29 | 18.29 | 18.29 | 18.29 |
| Inventories | 785,632.0 | 1,227,935.0 | 1,367,230.0 | 1,348,378.0 | 1,228,540.0 | 1,412,798.6 | 1,582,633.7 | 1,772,884.8 | 1,986,006.4 | 2,224,747.7 |
| Inventories, % | 24.34 | 28.13 | 25.95 | 26.06 | 25.28 | 25.95 | 25.95 | 25.95 | 25.95 | 25.95 |
| Accounts Payable | 436,211.0 | 615,923.0 | 636,527.0 | 667,072.0 | 595,954.0 | 706,195.5 | 791,088.5 | 886,186.6 | 992,716.6 | 1,112,052.8 |
| Accounts Payable, % | 13.52 | 14.11 | 12.08 | 12.89 | 12.26 | 12.97 | 12.97 | 12.97 | 12.97 | 12.97 |
| Capital Expenditure | -308,123.0 | -313,328.0 | -289,197.0 | -329,830.0 | -279,417.0 | -373,860.4 | -418,802.8 | -469,147.9 | -525,544.9 | -588,721.6 |
| Capital Expenditure, % | -9.55 | -7.18 | -5.49 | -6.37 | -5.75 | -6.87 | -6.87 | -6.87 | -6.87 | -6.87 |
| Tax Rate, % | 36.34 | 36.34 | 36.34 | 36.34 | 36.34 | 36.34 | 36.34 | 36.34 | 36.34 | 36.34 |
| EBITAT | -22,115.4 | 223,910.3 | 159,126.4 | 214,829.4 | 90,170.9 | 162,745.4 | 182,309.3 | 204,225.0 | 228,775.3 | 256,276.8 |
| Depreciation | ||||||||||
| Changes in Account Receivables | ||||||||||
| Changes in Inventories | ||||||||||
| Changes in Accounts Payable | ||||||||||
| Capital Expenditure | ||||||||||
| UFCF | -1,195,130.4 | -269,754.7 | 166,576.4 | 222,184.4 | 25,040.9 | -112,677.0 | -89,658.0 | -100,436.0 | -112,509.6 | -126,034.5 |
| WACC, % | 5.72 | 5.16 | 5.23 | 5.15 | 4.94 | 5.24 | 5.24 | 5.24 | 5.24 | 5.24 |
| PV UFCF | ||||||||||
| SUM PV UFCF | -463,511.4 | |||||||||
| Long Term Growth Rate, % | 2.00 | |||||||||
| Free cash flow (T + 1) | -128,555 | |||||||||
| Terminal Value | -3,965,300 | |||||||||
| Present Terminal Value | -3,071,359 | |||||||||
| Enterprise Value | -3,534,870 | |||||||||
| Net Debt | 1,593,609 | |||||||||
| Equity Value | -5,128,479 | |||||||||
| Diluted Shares Outstanding, MM | 668 | |||||||||
| Equity Value Per Share | -7,680.94 |
What You Will Receive
- Adjustable Forecast Inputs: Effortlessly modify assumptions (growth %, margins, WACC) to develop various scenarios.
- Current Financial Data: JFE Holdings, Inc.'s financial information pre-loaded to enhance your analysis.
- Automatic DCF Calculations: The template computes Net Present Value (NPV) and intrinsic value automatically.
- Customizable and Professional Design: A sleek Excel model tailored to fit your valuation requirements.
- Designed for Analysts and Investors: Perfect for evaluating projections, verifying strategies, and streamlining your workflow.
Key Features
- Pre-Loaded Data: Historical financial statements and pre-filled forecasts for JFE Holdings, Inc. (5411T).
- Fully Adjustable Inputs: Customize WACC, tax rates, revenue growth, and EBITDA margins to suit your analysis.
- Instant Results: Watch the intrinsic value of JFE Holdings, Inc. (5411T) update in real time.
- Clear Visual Outputs: Dashboard charts present valuation results and critical metrics clearly.
- Built for Accuracy: A professional-grade tool designed for analysts, investors, and finance professionals.
How It Operates
- Step 1: Download the Excel spreadsheet.
- Step 2: Examine the pre-filled JFE Holdings data (historical and forecasted).
- Step 3: Modify key assumptions (highlighted in yellow) according to your analysis.
- Step 4: Observe the automatic updates reflecting JFE Holdings' intrinsic value.
- Step 5: Utilize the results for investment strategies or reporting purposes.
Why Choose This Calculator for JFE Holdings, Inc. (5411T)?
- Accuracy: Utilizes real JFE financial data to ensure precise calculations.
- Flexibility: Tailored for users to easily adjust and experiment with input parameters.
- Time-Efficient: Eliminate the need to construct a DCF model from the ground up.
- Professional Quality: Crafted with the expertise and usability standards of CFOs in mind.
- Intuitive Design: Simple to navigate, suitable for users without extensive financial modeling skills.
Who Should Consider JFE Holdings, Inc. (5411T)?
- Investors: Assess JFE Holdings' fair value accurately before making investment choices.
- CFOs: Utilize a high-quality DCF model for financial analysis and reporting.
- Consultants: Easily tailor the template for client valuation reports.
- Entrepreneurs: Discover financial modeling techniques employed by leading corporations.
- Educators: Incorporate it as a teaching resource to illustrate valuation approaches.
Contents of the Template
- Pre-Filled Data: Features JFE Holdings, Inc. (5411T) historical financial performance and projections.
- Discounted Cash Flow Model: Fully editable DCF valuation model with automated calculations.
- Weighted Average Cost of Capital (WACC): A dedicated sheet for calculating WACC with user-defined inputs.
- Key Financial Ratios: Assess JFE Holdings, Inc. (5411T) profitability, efficiency, and financial leverage.
- Customizable Inputs: Easily modify revenue growth rates, profit margins, and tax rates.
- Clear Dashboard: Visual representations and tables summarizing essential valuation outcomes.
Disclaimer
All information, articles, and product details provided on this website are for general informational and educational purposes only. We do not claim any ownership over, nor do we intend to infringe upon, any trademarks, copyrights, logos, brand names, or other intellectual property mentioned or depicted on this site. Such intellectual property remains the property of its respective owners, and any references here are made solely for identification or informational purposes, without implying any affiliation, endorsement, or partnership.
We make no representations or warranties, express or implied, regarding the accuracy, completeness, or suitability of any content or products presented. Nothing on this website should be construed as legal, tax, investment, financial, medical, or other professional advice. In addition, no part of this site—including articles or product references—constitutes a solicitation, recommendation, endorsement, advertisement, or offer to buy or sell any securities, franchises, or other financial instruments, particularly in jurisdictions where such activity would be unlawful.
All content is of a general nature and may not address the specific circumstances of any individual or entity. It is not a substitute for professional advice or services. Any actions you take based on the information provided here are strictly at your own risk. You accept full responsibility for any decisions or outcomes arising from your use of this website and agree to release us from any liability in connection with your use of, or reliance upon, the content or products found herein.