
|
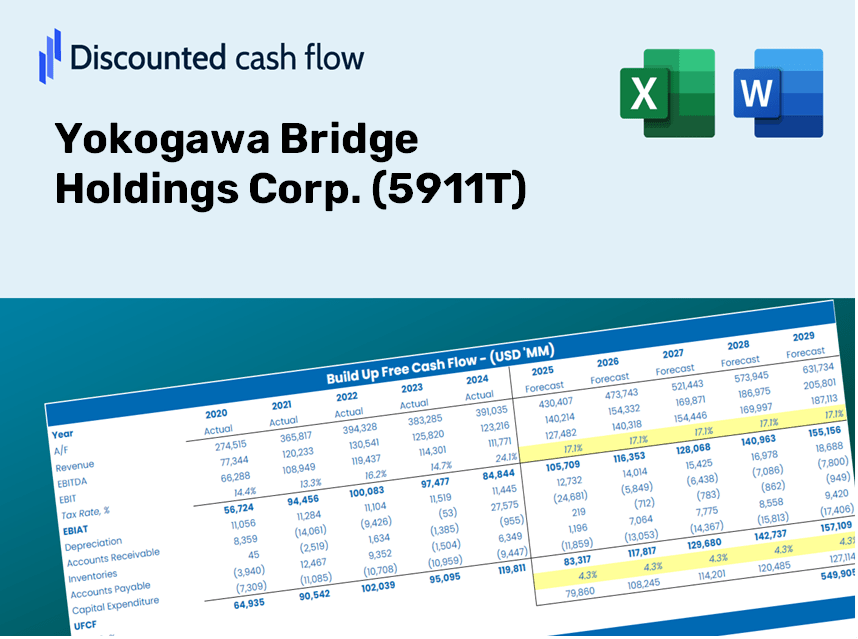
Yokogawa Bridge Holdings Corp. (5911.t) DCF -Bewertung |
Fully Editable: Tailor To Your Needs In Excel Or Sheets
Professional Design: Trusted, Industry-Standard Templates
Investor-Approved Valuation Models
MAC/PC Compatible, Fully Unlocked
No Expertise Is Needed; Easy To Follow
Yokogawa Bridge Holdings Corp. (5911.T) Bundle
Bewerten Sie die finanziellen Aussichten der Yokogawa Bridge Holdings Corp. wie ein Experte! Dieser (5911t) DCF-Taschenrechner bietet Ihnen vorgefüllte Finanzdaten und die Flexibilität, das Umsatzwachstum, WACC, Margen und andere wesentliche Annahmen zu ändern, um sich an Ihren Projektionen anzupassen.
Discounted Cash Flow (DCF) - (USD MM)
| Year | AY1 2020 |
AY2 2021 |
AY3 2022 |
AY4 2023 |
AY5 2024 |
FY1 2025 |
FY2 2026 |
FY3 2027 |
FY4 2028 |
FY5 2029 |
|---|---|---|---|---|---|---|---|---|---|---|
| Revenue | 136,091.0 | 136,931.0 | 164,968.0 | 164,076.0 | 159,368.0 | 166,413.0 | 173,769.5 | 181,451.1 | 189,472.4 | 197,848.2 |
| Revenue Growth, % | 0 | 0.61723 | 20.48 | -0.54071 | -2.87 | 4.42 | 4.42 | 4.42 | 4.42 | 4.42 |
| EBITDA | 20,072.0 | 18,423.0 | 20,518.0 | 21,680.0 | 22,563.0 | 22,636.1 | 23,636.8 | 24,681.7 | 25,772.8 | 26,912.1 |
| EBITDA, % | 14.75 | 13.45 | 12.44 | 13.21 | 14.16 | 13.6 | 13.6 | 13.6 | 13.6 | 13.6 |
| Depreciation | 3,447.0 | 3,670.0 | 3,879.0 | 3,830.0 | 4,307.0 | 4,194.0 | 4,379.4 | 4,573.0 | 4,775.2 | 4,986.3 |
| Depreciation, % | 2.53 | 2.68 | 2.35 | 2.33 | 2.7 | 2.52 | 2.52 | 2.52 | 2.52 | 2.52 |
| EBIT | 16,625.0 | 14,753.0 | 16,639.0 | 17,850.0 | 18,256.0 | 18,442.1 | 19,257.4 | 20,108.7 | 20,997.6 | 21,925.8 |
| EBIT, % | 12.22 | 10.77 | 10.09 | 10.88 | 11.46 | 11.08 | 11.08 | 11.08 | 11.08 | 11.08 |
| Total Cash | 19,602.0 | 23,458.0 | 25,143.0 | 24,988.0 | 16,832.0 | 24,152.3 | 25,219.9 | 26,334.8 | 27,499.0 | 28,714.6 |
| Total Cash, percent | .0 | .0 | .0 | .0 | .0 | .0 | .0 | .0 | .0 | .0 |
| Account Receivables | 80,118.0 | 78,330.0 | 101,026.0 | 114,117.0 | 127,137.0 | 108,714.9 | 113,520.7 | 118,539.0 | 123,779.1 | 129,250.9 |
| Account Receivables, % | 58.87 | 57.2 | 61.24 | 69.55 | 79.78 | 65.33 | 65.33 | 65.33 | 65.33 | 65.33 |
| Inventories | 2,365.0 | 3,562.0 | 3,745.0 | 3,287.0 | 3,445.0 | 3,586.0 | 3,744.5 | 3,910.0 | 4,082.8 | 4,263.3 |
| Inventories, % | 1.74 | 2.6 | 2.27 | 2 | 2.16 | 2.15 | 2.15 | 2.15 | 2.15 | 2.15 |
| Accounts Payable | 16,330.0 | 21,827.0 | 26,343.0 | 22,030.0 | 19,130.0 | 23,077.6 | 24,097.8 | 25,163.1 | 26,275.4 | 27,436.9 |
| Accounts Payable, % | 12 | 15.94 | 15.97 | 13.43 | 12 | 13.87 | 13.87 | 13.87 | 13.87 | 13.87 |
| Capital Expenditure | -6,456.0 | -4,908.0 | -3,778.0 | -4,350.0 | -3,217.0 | -5,088.3 | -5,313.2 | -5,548.1 | -5,793.4 | -6,049.5 |
| Capital Expenditure, % | -4.74 | -3.58 | -2.29 | -2.65 | -2.02 | -3.06 | -3.06 | -3.06 | -3.06 | -3.06 |
| Tax Rate, % | 28.52 | 28.52 | 28.52 | 28.52 | 28.52 | 28.52 | 28.52 | 28.52 | 28.52 | 28.52 |
| EBITAT | 11,358.7 | 10,014.0 | 11,319.2 | 12,069.7 | 13,049.9 | 12,663.4 | 13,223.2 | 13,807.8 | 14,418.1 | 15,055.5 |
| Depreciation | ||||||||||
| Changes in Account Receivables | ||||||||||
| Changes in Inventories | ||||||||||
| Changes in Accounts Payable | ||||||||||
| Capital Expenditure | ||||||||||
| UFCF | -57,803.3 | 14,864.0 | -6,942.8 | -5,396.3 | -1,938.1 | 33,998.0 | 8,345.2 | 8,714.1 | 9,099.3 | 9,501.6 |
| WACC, % | 6.52 | 6.51 | 6.52 | 6.51 | 6.55 | 6.52 | 6.52 | 6.52 | 6.52 | 6.52 |
| PV UFCF | ||||||||||
| SUM PV UFCF | 60,476.7 | |||||||||
| Long Term Growth Rate, % | 2.00 | |||||||||
| Free cash flow (T + 1) | 9,692 | |||||||||
| Terminal Value | 214,364 | |||||||||
| Present Terminal Value | 156,306 | |||||||||
| Enterprise Value | 216,782 | |||||||||
| Net Debt | 17,668 | |||||||||
| Equity Value | 199,114 | |||||||||
| Diluted Shares Outstanding, MM | 41 | |||||||||
| Equity Value Per Share | 4,908.94 |
What You Will Receive
- Customizable Excel Template: A fully editable Excel-based DCF Calculator featuring pre-filled financial data for Yokogawa Bridge Holdings Corp. (5911T).
- Accurate Data: Access to historical performance and projected estimates (highlighted in the yellow cells).
- Flexible Forecasting: Adjust key assumptions such as revenue growth rates, EBITDA margins, and WACC.
- Real-Time Calculations: Instantly observe how your input changes affect the valuation of Yokogawa Bridge Holdings Corp. (5911T).
- Professional Financial Tool: Designed for investors, CFOs, consultants, and financial analysts.
- User-Centric Layout: Organized for simplicity and ease of navigation, complete with step-by-step guidance.
Key Features
- Authentic Financial Data for Yokogawa Bridge Holdings: Gain access to precise historical figures and future forecasts.
- Adjustable Forecast Parameters: Modify highlighted fields such as WACC, growth rates, and profit margins to suit your analysis.
- Real-Time Calculations: Enjoy automatic updates for DCF, Net Present Value (NPV), and cash flow assessments.
- User-Friendly Dashboard: Utilize intuitive charts and summaries for an at-a-glance view of your valuation outcomes.
- Designed for All Skill Levels: An easy-to-navigate layout tailored for investors, CFOs, and consultants alike.
How It Operates
- Download: Get the pre-prepared Excel file containing Yokogawa Bridge Holdings Corp.'s (5911T) financial data.
- Customize: Fine-tune forecasts such as revenue growth, EBITDA %, and WACC.
- Update Automatically: The intrinsic value and NPV calculations refresh in real-time.
- Test Scenarios: Generate multiple projections and instantly compare the results.
- Make Decisions: Leverage the valuation outcomes to shape your investment strategy.
Why Select Yokogawa Bridge Holdings Corp. ([5911T]) Calculator?
- Time-Efficient: Skip the hassle of building a DCF model from the ground up – it's immediately available for use.
- Enhanced Precision: Dependable financial data and formulas minimize valuation inaccuracies.
- Fully Adaptable: Customize the model to align with your own assumptions and forecasts.
- User-Friendly: Intuitive charts and outputs facilitate straightforward analysis of results.
- Endorsed by Professionals: Crafted for industry experts who prioritize both accuracy and functionality.
Who Can Benefit from This Product?
- Investors: Evaluate the valuation of Yokogawa Bridge Holdings Corp. (5911T) prior to trading shares.
- CFOs and Financial Analysts: Enhance valuation methodologies and assess financial forecasts.
- Startup Founders: Gain insights into the valuation techniques used for established firms like Yokogawa Bridge Holdings Corp. (5911T).
- Consultants: Create detailed valuation reports for your clientele.
- Students and Educators: Utilize real-world examples for practicing and teaching valuation strategies.
Contents of the Template
- Historical Data: Contains Yokogawa Bridge Holdings Corp.’s past financial performance and foundational forecasts.
- DCF and Levered DCF Models: Comprehensive templates designed to assess the intrinsic value of Yokogawa Bridge Holdings Corp.
- WACC Sheet: Ready-to-use calculations for Weighted Average Cost of Capital.
- Editable Inputs: Adjust critical drivers such as growth rates, EBITDA percentages, and CAPEX projections.
- Quarterly and Annual Statements: Detailed analysis of Yokogawa Bridge Holdings Corp.’s financials.
- Interactive Dashboard: Dynamically visualize valuation outcomes and forecasts.
Disclaimer
All information, articles, and product details provided on this website are for general informational and educational purposes only. We do not claim any ownership over, nor do we intend to infringe upon, any trademarks, copyrights, logos, brand names, or other intellectual property mentioned or depicted on this site. Such intellectual property remains the property of its respective owners, and any references here are made solely for identification or informational purposes, without implying any affiliation, endorsement, or partnership.
We make no representations or warranties, express or implied, regarding the accuracy, completeness, or suitability of any content or products presented. Nothing on this website should be construed as legal, tax, investment, financial, medical, or other professional advice. In addition, no part of this site—including articles or product references—constitutes a solicitation, recommendation, endorsement, advertisement, or offer to buy or sell any securities, franchises, or other financial instruments, particularly in jurisdictions where such activity would be unlawful.
All content is of a general nature and may not address the specific circumstances of any individual or entity. It is not a substitute for professional advice or services. Any actions you take based on the information provided here are strictly at your own risk. You accept full responsibility for any decisions or outcomes arising from your use of this website and agree to release us from any liability in connection with your use of, or reliance upon, the content or products found herein.