
|
Hua Xia Bank Co., Limited (600015.SS) DCF -Bewertung |
Fully Editable: Tailor To Your Needs In Excel Or Sheets
Professional Design: Trusted, Industry-Standard Templates
Investor-Approved Valuation Models
MAC/PC Compatible, Fully Unlocked
No Expertise Is Needed; Easy To Follow
Hua Xia Bank Co., Limited (600015.SS) Bundle
Vereinfachen Sie die Hua Xia Bank Co., Limited (600015SS) Bewertung mit diesem anpassbaren DCF -Taschenrechner! Mit Real Hua Xia Bank Co., Limited (600015SS) Finanzdaten und einstellbaren prognostizierenden Inputs können Sie Szenarien testen und die Hua Xia Bank Co., Limited (600015SS) in Protokollen aufdecken.
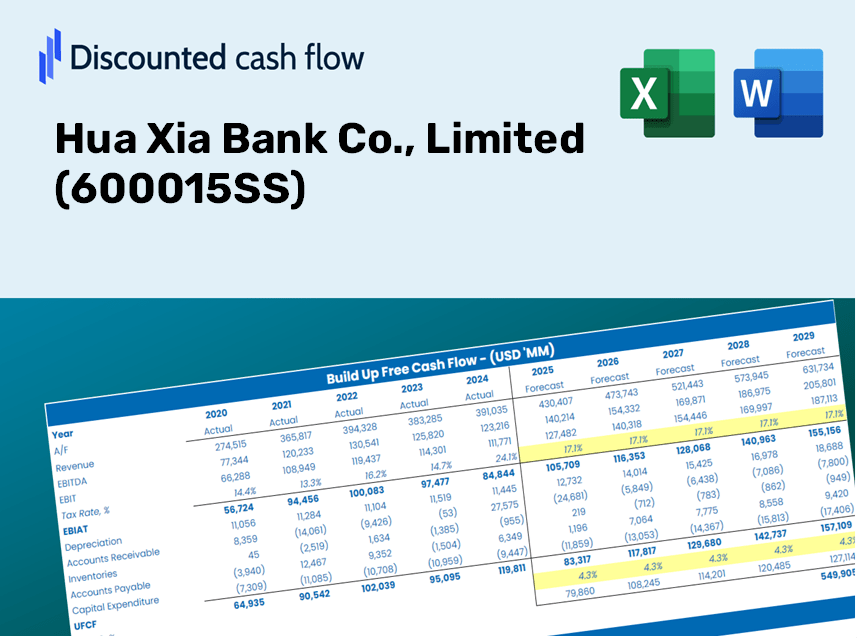
Discounted Cash Flow (DCF) - (USD MM)
| Year | AY1 2020 |
AY2 2021 |
AY3 2022 |
AY4 2023 |
AY5 2024 |
FY1 2025 |
FY2 2026 |
FY3 2027 |
FY4 2028 |
FY5 2029 |
|---|---|---|---|---|---|---|---|---|---|---|
| Revenue | 55,299.0 | 60,672.0 | 63,075.0 | 67,787.0 | 68,641.0 | 72,486.1 | 76,546.7 | 80,834.7 | 85,362.9 | 90,144.7 |
| Revenue Growth, % | 0 | 9.72 | 3.96 | 7.47 | 1.26 | 5.6 | 5.6 | 5.6 | 5.6 | 5.6 |
| EBITDA | 29,996.0 | 40,813.0 | 36,700.0 | 39,634.0 | 36,877.0 | 42,315.8 | 44,686.3 | 47,189.5 | 49,833.0 | 52,624.5 |
| EBITDA, % | 54.24 | 67.27 | 58.18 | 58.47 | 53.72 | 58.38 | 58.38 | 58.38 | 58.38 | 58.38 |
| Depreciation | 1,084.0 | .0 | 3,117.0 | 4,195.0 | .0 | 1,897.8 | 2,004.1 | 2,116.3 | 2,234.9 | 2,360.1 |
| Depreciation, % | 1.96 | 0 | 4.94 | 6.19 | 0 | 2.62 | 2.62 | 2.62 | 2.62 | 2.62 |
| EBIT | 28,912.0 | 40,813.0 | 33,583.0 | 35,439.0 | 36,877.0 | 40,418.1 | 42,682.2 | 45,073.2 | 47,598.1 | 50,264.4 |
| EBIT, % | 52.28 | 67.27 | 53.24 | 52.28 | 53.72 | 55.76 | 55.76 | 55.76 | 55.76 | 55.76 |
| Total Cash | 259,057.0 | 287,140.0 | 250,894.0 | 59,762.0 | 253,216.0 | 70,769.9 | 74,734.3 | 78,920.7 | 83,341.7 | 88,010.3 |
| Total Cash, percent | .0 | .0 | .0 | .0 | .0 | .0 | .0 | .0 | .0 | .0 |
| Account Receivables | .0 | .0 | .0 | .0 | .0 | .0 | .0 | .0 | .0 | .0 |
| Account Receivables, % | 0 | 0 | 0 | 0 | 0 | 0 | 0 | 0 | 0 | 0 |
| Inventories | .0 | .0 | .0 | .0 | .0 | .0 | .0 | .0 | .0 | .0 |
| Inventories, % | 0 | 0 | 0 | 0 | 0 | 0 | 0 | 0 | 0 | 0 |
| Accounts Payable | .0 | .0 | .0 | .0 | .0 | .0 | .0 | .0 | .0 | .0 |
| Accounts Payable, % | 0 | 0 | 0 | 0 | 0 | 0 | 0 | 0 | 0 | 0 |
| Capital Expenditure | -1,266.0 | -1,652.0 | -21,954.0 | -32,888.0 | -16,688.0 | -16,330.7 | -17,245.5 | -18,211.6 | -19,231.8 | -20,309.1 |
| Capital Expenditure, % | -2.29 | -2.72 | -34.81 | -48.52 | -24.31 | -22.53 | -22.53 | -22.53 | -22.53 | -22.53 |
| Tax Rate, % | 22.86 | 22.86 | 22.86 | 22.86 | 22.86 | 22.86 | 22.86 | 22.86 | 22.86 | 22.86 |
| EBITAT | 22,653.2 | 30,499.9 | 25,035.0 | 26,363.0 | 28,445.8 | 30,649.6 | 32,366.5 | 34,179.6 | 36,094.3 | 38,116.2 |
| Depreciation | ||||||||||
| Changes in Account Receivables | ||||||||||
| Changes in Inventories | ||||||||||
| Changes in Accounts Payable | ||||||||||
| Capital Expenditure | ||||||||||
| UFCF | 22,471.2 | 28,847.9 | 6,198.0 | -2,330.0 | 11,757.8 | 16,216.6 | 17,125.0 | 18,084.4 | 19,097.4 | 20,167.2 |
| WACC, % | 3.71 | 3.56 | 3.55 | 3.54 | 3.66 | 3.6 | 3.6 | 3.6 | 3.6 | 3.6 |
| PV UFCF | ||||||||||
| SUM PV UFCF | 81,340.3 | |||||||||
| Long Term Growth Rate, % | 2.00 | |||||||||
| Free cash flow (T + 1) | 20,571 | |||||||||
| Terminal Value | 1,282,697 | |||||||||
| Present Terminal Value | 1,074,603 | |||||||||
| Enterprise Value | 1,155,943 | |||||||||
| Net Debt | 164,535 | |||||||||
| Equity Value | 991,408 | |||||||||
| Diluted Shares Outstanding, MM | 15,915 | |||||||||
| Equity Value Per Share | 62.29 |
Benefits You Will Receive
- Customizable Excel Template: A fully adaptable Excel-based DCF Calculator featuring pre-filled actual financials for Hua Xia Bank Co., Limited (600015SS).
- Accurate Data: Access to historical performance data and future projections (highlighted in the yellow cells).
- Flexible Forecasting: Modify key assumptions such as revenue growth, EBITDA %, and WACC to suit your analysis.
- Real-Time Calculations: Instantly observe how your inputs affect the valuation of Hua Xia Bank Co., Limited (600015SS).
- Professional Resource: Designed for investors, CFOs, consultants, and financial analysts.
- Intuitive Layout: Organized for simplicity and ease of navigation, complete with detailed instructions.
Key Features
- 🔍 Real-Life HXBC Financials: Access pre-filled historical and projected financial data for Hua Xia Bank Co., Limited (600015SS).
- ✏️ Fully Customizable Inputs: Modify all essential parameters (yellow cells) such as WACC, growth %, and tax rates.
- 📊 Professional DCF Valuation: Utilize built-in formulas to calculate the intrinsic value of Hua Xia Bank using the Discounted Cash Flow method.
- ⚡ Instant Results: Observe Hua Xia Bank's valuation immediately after any adjustments.
- Scenario Analysis: Evaluate and compare various financial assumptions side-by-side.
How It Operates
- 1. Access the Template: Download and open the Excel file featuring Hua Xia Bank Co., Limited’s (600015SS) preloaded data.
- 2. Modify Assumptions: Adjust essential inputs such as growth projections, WACC, and capital expenditures.
- 3. View Instant Results: The DCF model automatically computes intrinsic value and NPV in real-time.
- 4. Explore Scenarios: Evaluate multiple forecasts to assess various valuation results.
- 5. Present with Confidence: Deliver professional valuation analysis to enhance your decision-making process.
Why Choose This Calculator for Hua Xia Bank Co., Limited (600015SS)?
- Reliable Data: Access to authentic Hua Xia Bank financial metrics guarantees trustworthy valuation outcomes.
- Customizable Options: Tailor key inputs such as growth forecasts, WACC, and tax rates to align with your specific expectations.
- Time Efficiency: Built-in calculations save you the hassle of starting from the ground up.
- Professional-Quality Tool: Crafted for use by investors, analysts, and financial consultants.
- User-Friendly Design: Easy-to-navigate layout and clear instructions ensure accessibility for all users.
Who Should Consider Hua Xia Bank Co., Limited (600015SS)?
- Investors: Make informed investment choices with a robust evaluation resource tailored for banking insights.
- Financial Analysts: Enhance efficiency with a pre-designed financial model that allows for easy modifications.
- Consultants: Seamlessly customize the framework for client presentations or detailed reports.
- Finance Enthusiasts: Expand your knowledge of banking and valuation methods through practical, real-world applications.
- Educators and Students: Utilize this resource as an effective teaching aid in finance and banking courses.
Contents of the Template
- Pre-Filled Data: Contains Hua Xia Bank’s historical financials and forecasts.
- Discounted Cash Flow Model: Editable DCF valuation model with automated calculations.
- Weighted Average Cost of Capital (WACC): A dedicated sheet for WACC calculations based on custom inputs.
- Key Financial Ratios: Evaluate Hua Xia Bank's profitability, efficiency, and financial leverage.
- Customizable Inputs: Easily modify revenue growth, margins, and tax rates.
- Clear Dashboard: Visual representations and tables summarizing crucial valuation outcomes.
Disclaimer
All information, articles, and product details provided on this website are for general informational and educational purposes only. We do not claim any ownership over, nor do we intend to infringe upon, any trademarks, copyrights, logos, brand names, or other intellectual property mentioned or depicted on this site. Such intellectual property remains the property of its respective owners, and any references here are made solely for identification or informational purposes, without implying any affiliation, endorsement, or partnership.
We make no representations or warranties, express or implied, regarding the accuracy, completeness, or suitability of any content or products presented. Nothing on this website should be construed as legal, tax, investment, financial, medical, or other professional advice. In addition, no part of this site—including articles or product references—constitutes a solicitation, recommendation, endorsement, advertisement, or offer to buy or sell any securities, franchises, or other financial instruments, particularly in jurisdictions where such activity would be unlawful.
All content is of a general nature and may not address the specific circumstances of any individual or entity. It is not a substitute for professional advice or services. Any actions you take based on the information provided here are strictly at your own risk. You accept full responsibility for any decisions or outcomes arising from your use of this website and agree to release us from any liability in connection with your use of, or reliance upon, the content or products found herein.