
|
Sany Heavy Industry Co., Ltd (600031.SS) DCF -Bewertung |
Fully Editable: Tailor To Your Needs In Excel Or Sheets
Professional Design: Trusted, Industry-Standard Templates
Investor-Approved Valuation Models
MAC/PC Compatible, Fully Unlocked
No Expertise Is Needed; Easy To Follow
Sany Heavy Industry Co., Ltd (600031.SS) Bundle
Unabhängig davon, ob Sie ein Investor oder Analyst sind, ist dieser (600031S) DCF-Taschenrechner Ihr Anlaufwerk für eine genaue Bewertung. Mit realen Daten von vorinstallierter Ltd. Sany Heavy Industry Co., Ltd können Sie Prognosen anpassen und die Auswirkungen in Echtzeit beobachten.
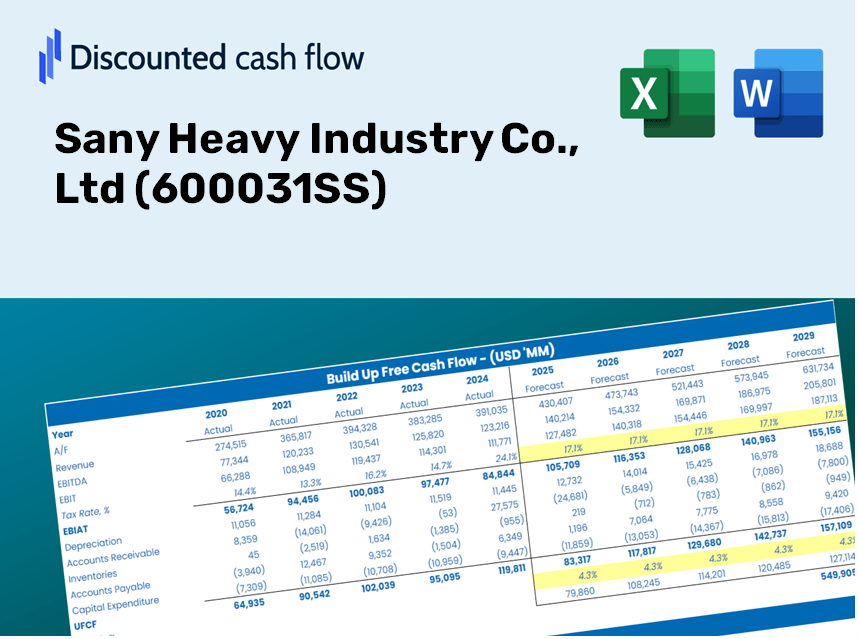
Discounted Cash Flow (DCF) - (USD MM)
| Year | AY1 2020 |
AY2 2021 |
AY3 2022 |
AY4 2023 |
AY5 2024 |
FY1 2025 |
FY2 2026 |
FY3 2027 |
FY4 2028 |
FY5 2029 |
|---|---|---|---|---|---|---|---|---|---|---|
| Revenue | 100,054.7 | 106,873.4 | 80,838.5 | 74,018.9 | 78,383.4 | 74,447.5 | 70,709.3 | 67,158.8 | 63,786.5 | 60,583.6 |
| Revenue Growth, % | 0 | 6.81 | -24.36 | -8.44 | 5.9 | -5.02 | -5.02 | -5.02 | -5.02 | -5.02 |
| EBITDA | 19,467.4 | 15,116.0 | 6,302.3 | 7,961.3 | 9,386.7 | 9,548.3 | 9,068.9 | 8,613.5 | 8,181.0 | 7,770.2 |
| EBITDA, % | 19.46 | 14.14 | 7.8 | 10.76 | 11.98 | 12.83 | 12.83 | 12.83 | 12.83 | 12.83 |
| Depreciation | 1,889.8 | 1,994.4 | 2,402.1 | 2,870.9 | 2,859.4 | 2,122.2 | 2,015.6 | 1,914.4 | 1,818.3 | 1,727.0 |
| Depreciation, % | 1.89 | 1.87 | 2.97 | 3.88 | 3.65 | 2.85 | 2.85 | 2.85 | 2.85 | 2.85 |
| EBIT | 17,577.6 | 13,121.7 | 3,900.2 | 5,090.4 | 6,527.3 | 7,426.1 | 7,053.3 | 6,699.1 | 6,362.7 | 6,043.2 |
| EBIT, % | 17.57 | 12.28 | 4.82 | 6.88 | 8.33 | 9.97 | 9.97 | 9.97 | 9.97 | 9.97 |
| Total Cash | 26,809.5 | 29,585.3 | 36,159.5 | 33,841.8 | 31,445.6 | 27,552.4 | 26,168.9 | 24,854.9 | 23,606.9 | 22,421.5 |
| Total Cash, percent | .0 | .0 | .0 | .0 | .0 | .0 | .0 | .0 | .0 | .0 |
| Account Receivables | 26,511.1 | 27,049.9 | 32,103.0 | 42,187.0 | 29,861.9 | 27,785.5 | 26,390.3 | 25,065.2 | 23,806.6 | 22,611.2 |
| Account Receivables, % | 26.5 | 25.31 | 39.71 | 56.99 | 38.1 | 37.32 | 37.32 | 37.32 | 37.32 | 37.32 |
| Inventories | 19,197.9 | 18,462.6 | 19,738.4 | 19,767.8 | 19,948.0 | 16,830.4 | 15,985.3 | 15,182.6 | 14,420.3 | 13,696.2 |
| Inventories, % | 19.19 | 17.28 | 24.42 | 26.71 | 25.45 | 22.61 | 22.61 | 22.61 | 22.61 | 22.61 |
| Accounts Payable | 24,892.4 | 20,484.1 | 28,906.7 | 17,617.7 | 28,654.4 | 20,869.5 | 19,821.6 | 18,826.3 | 17,880.9 | 16,983.1 |
| Accounts Payable, % | 24.88 | 19.17 | 35.76 | 23.8 | 36.56 | 28.03 | 28.03 | 28.03 | 28.03 | 28.03 |
| Capital Expenditure | -5,059.9 | -10,300.0 | -5,665.0 | -4,525.2 | -2,938.3 | -4,699.8 | -4,463.8 | -4,239.7 | -4,026.8 | -3,824.6 |
| Capital Expenditure, % | -5.06 | -9.64 | -7.01 | -6.11 | -3.75 | -6.31 | -6.31 | -6.31 | -6.31 | -6.31 |
| Tax Rate, % | 13.5 | 13.5 | 13.5 | 13.5 | 13.5 | 13.5 | 13.5 | 13.5 | 13.5 | 13.5 |
| EBITAT | 14,635.8 | 11,395.7 | 3,447.9 | 4,334.8 | 5,646.4 | 6,389.1 | 6,068.2 | 5,763.5 | 5,474.1 | 5,199.3 |
| Depreciation | ||||||||||
| Changes in Account Receivables | ||||||||||
| Changes in Inventories | ||||||||||
| Changes in Accounts Payable | ||||||||||
| Capital Expenditure | ||||||||||
| UFCF | -9,350.9 | -1,121.8 | 2,278.7 | -18,721.8 | 28,748.9 | 1,220.6 | 4,812.4 | 4,570.8 | 4,341.2 | 4,123.3 |
| WACC, % | 8.19 | 8.2 | 8.21 | 8.2 | 8.2 | 8.2 | 8.2 | 8.2 | 8.2 | 8.2 |
| PV UFCF | ||||||||||
| SUM PV UFCF | 14,794.3 | |||||||||
| Long Term Growth Rate, % | 3.50 | |||||||||
| Free cash flow (T + 1) | 4,268 | |||||||||
| Terminal Value | 90,779 | |||||||||
| Present Terminal Value | 61,210 | |||||||||
| Enterprise Value | 76,005 | |||||||||
| Net Debt | 1,176 | |||||||||
| Equity Value | 74,829 | |||||||||
| Diluted Shares Outstanding, MM | 8,463 | |||||||||
| Equity Value Per Share | 8.84 |
What You Will Receive
- Genuine SANY Financials: Access to historical and projected data for precise valuation.
- Customizable Inputs: Adjust WACC, tax rates, revenue growth, and capital expenditures as needed.
- Automated Calculations: Intrinsic value and NPV computed in real-time.
- Scenario Analysis: Evaluate various scenarios to assess SANY’s future performance.
- User-Friendly Interface: Designed for professionals but easy for newcomers to navigate.
Key Features
- Pre-Loaded Data: Sany Heavy Industry's historical financial statements and pre-filled forecasts.
- Fully Adjustable Inputs: Modify WACC, tax rates, revenue growth, and EBITDA margins.
- Instant Results: View Sany Heavy Industry's intrinsic value recalculating in real time.
- Clear Visual Outputs: Dashboard charts present valuation results and key metrics.
- Built for Accuracy: A professional tool designed for analysts, investors, and finance professionals.
How It Works
- Download: Get started with the preformatted Excel file featuring Sany Heavy Industry Co., Ltd's (600031SS) financial data.
- Customize: Tailor your forecasts, including revenue growth, EBITDA %, and WACC to fit your analysis.
- Update Automatically: Watch as intrinsic value and NPV calculations refresh in real-time.
- Test Scenarios: Develop various projections and quickly compare the results.
- Make Decisions: Leverage the valuation outcomes to inform your investment approach.
Why Opt for Sany Heavy Industry Co., Ltd (600031SS)?
- Time-Efficient: Skip the hassle of building models from the ground up – our tools are ready for immediate use.
- Enhanced Precision: Dependable financial data and methodologies minimize errors in your evaluations.
- Completely Customizable: Adjust the model to align with your unique assumptions and forecasts.
- User-Friendly: Intuitive charts and outputs facilitate straightforward analysis of the results.
- Endorsed by Professionals: Crafted for experts who prioritize accuracy and functionality.
Who Can Benefit from This Product?
- Finance Students: Master valuation techniques and practice with actual market data related to Sany Heavy Industry Co., Ltd (600031SS).
- Researchers: Integrate advanced models into your academic projects or studies focused on economic trends.
- Investors: Validate your hypotheses and evaluate the valuation metrics for Sany Heavy Industry Co., Ltd (600031SS).
- Financial Analysts: Enhance your efficiency with a ready-made, adaptable DCF model tailored for Sany Heavy Industry Co., Ltd (600031SS).
- Entrepreneurs: Discover the analytical approaches employed in assessing large publicly traded companies like Sany Heavy Industry Co., Ltd (600031SS).
What the Template Includes
- Operating and Balance Sheet Data: Pre-filled historical data and forecasts for Sany Heavy Industry Co., Ltd (600031SS), encompassing revenue, EBITDA, EBIT, and capital expenditures.
- WACC Calculation: A specific sheet dedicated to the Weighted Average Cost of Capital (WACC), featuring parameters such as Beta, risk-free rate, and share price.
- DCF Valuation (Unlevered and Levered): Customizable Discounted Cash Flow models illustrating intrinsic value with comprehensive calculations.
- Financial Statements: Pre-loaded financial statements (both annual and quarterly) to aid in analysis.
- Key Ratios: Includes profitability, leverage, and efficiency ratios relevant to Sany Heavy Industry Co., Ltd (600031SS).
- Dashboard and Charts: A visual overview of valuation outputs and assumptions, facilitating easy analysis of results.
Disclaimer
All information, articles, and product details provided on this website are for general informational and educational purposes only. We do not claim any ownership over, nor do we intend to infringe upon, any trademarks, copyrights, logos, brand names, or other intellectual property mentioned or depicted on this site. Such intellectual property remains the property of its respective owners, and any references here are made solely for identification or informational purposes, without implying any affiliation, endorsement, or partnership.
We make no representations or warranties, express or implied, regarding the accuracy, completeness, or suitability of any content or products presented. Nothing on this website should be construed as legal, tax, investment, financial, medical, or other professional advice. In addition, no part of this site—including articles or product references—constitutes a solicitation, recommendation, endorsement, advertisement, or offer to buy or sell any securities, franchises, or other financial instruments, particularly in jurisdictions where such activity would be unlawful.
All content is of a general nature and may not address the specific circumstances of any individual or entity. It is not a substitute for professional advice or services. Any actions you take based on the information provided here are strictly at your own risk. You accept full responsibility for any decisions or outcomes arising from your use of this website and agree to release us from any liability in connection with your use of, or reliance upon, the content or products found herein.