
|
Humanwell Healthcare Co., Ltd. (600079.SS) DCF -Bewertung |
Fully Editable: Tailor To Your Needs In Excel Or Sheets
Professional Design: Trusted, Industry-Standard Templates
Investor-Approved Valuation Models
MAC/PC Compatible, Fully Unlocked
No Expertise Is Needed; Easy To Follow
Humanwell Healthcare (Group) Co.,Ltd. (600079.SS) Bundle
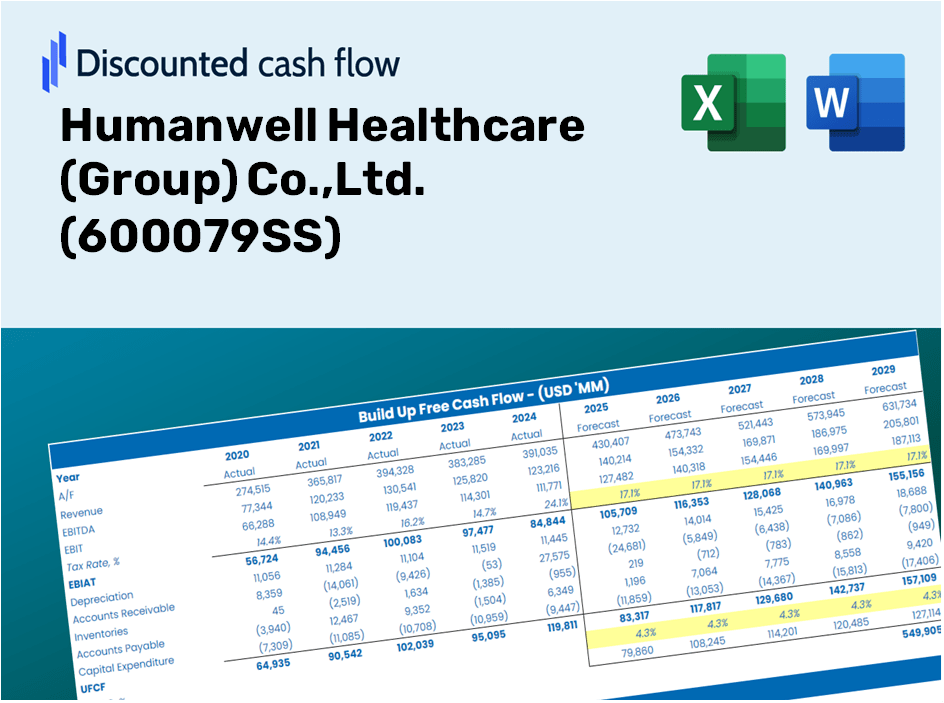
Gewinnen Sie Einblicke in Ihre Humanwell Healthcare (Group) Co., Ltd. (600079SS) Bewertungsanalyse mit unserem DCF-Taschenrechner des hochmodernen DCF! Diese Excel -Vorlage wird mit realen (600079S) Daten vorinstalliert, sodass Sie Prognosen und Annahmen für eine genaue Berechnung des inneren Wertes von Humanwell Healthcare anpassen können.
Discounted Cash Flow (DCF) - (USD MM)
| Year | AY1 2020 |
AY2 2021 |
AY3 2022 |
AY4 2023 |
AY5 2024 |
FY1 2025 |
FY2 2026 |
FY3 2027 |
FY4 2028 |
FY5 2029 |
|---|---|---|---|---|---|---|---|---|---|---|
| Revenue | 20,680.1 | 20,548.9 | 22,337.7 | 24,524.7 | 25,435.5 | 26,807.4 | 28,253.3 | 29,777.2 | 31,383.4 | 33,076.1 |
| Revenue Growth, % | 0 | -0.63433 | 8.71 | 9.79 | 3.71 | 5.39 | 5.39 | 5.39 | 5.39 | 5.39 |
| EBITDA | 3,336.9 | 3,020.3 | 3,371.9 | 4,108.0 | 3,875.8 | 4,177.5 | 4,402.8 | 4,640.3 | 4,890.6 | 5,154.4 |
| EBITDA, % | 16.14 | 14.7 | 15.09 | 16.75 | 15.24 | 15.58 | 15.58 | 15.58 | 15.58 | 15.58 |
| Depreciation | 680.7 | 659.2 | 723.1 | 788.8 | 862.2 | 876.2 | 923.5 | 973.3 | 1,025.8 | 1,081.1 |
| Depreciation, % | 3.29 | 3.21 | 3.24 | 3.22 | 3.39 | 3.27 | 3.27 | 3.27 | 3.27 | 3.27 |
| EBIT | 2,656.2 | 2,361.0 | 2,648.8 | 3,319.3 | 3,013.6 | 3,301.3 | 3,479.4 | 3,667.0 | 3,864.8 | 4,073.3 |
| EBIT, % | 12.84 | 11.49 | 11.86 | 13.53 | 11.85 | 12.31 | 12.31 | 12.31 | 12.31 | 12.31 |
| Total Cash | 6,202.9 | 6,100.0 | 6,121.9 | 5,040.8 | 4,949.6 | 6,814.4 | 7,182.0 | 7,569.4 | 7,977.7 | 8,407.9 |
| Total Cash, percent | .0 | .0 | .0 | .0 | .0 | .0 | .0 | .0 | .0 | .0 |
| Account Receivables | 7,390.1 | 8,086.8 | 8,274.1 | 9,560.0 | 10,683.7 | 10,353.8 | 10,912.2 | 11,500.8 | 12,121.1 | 12,774.9 |
| Account Receivables, % | 35.74 | 39.35 | 37.04 | 38.98 | 42 | 38.62 | 38.62 | 38.62 | 38.62 | 38.62 |
| Inventories | 2,656.7 | 3,126.6 | 3,420.7 | 3,618.9 | 3,566.4 | 3,868.5 | 4,077.1 | 4,297.1 | 4,528.8 | 4,773.1 |
| Inventories, % | 12.85 | 15.22 | 15.31 | 14.76 | 14.02 | 14.43 | 14.43 | 14.43 | 14.43 | 14.43 |
| Accounts Payable | 2,396.1 | 2,687.1 | 3,449.0 | 3,212.7 | 3,083.9 | 3,502.6 | 3,691.5 | 3,890.6 | 4,100.4 | 4,321.6 |
| Accounts Payable, % | 11.59 | 13.08 | 15.44 | 13.1 | 12.12 | 13.07 | 13.07 | 13.07 | 13.07 | 13.07 |
| Capital Expenditure | -1,098.0 | -1,703.0 | -3,113.3 | -1,958.3 | -1,020.9 | -2,119.6 | -2,233.9 | -2,354.4 | -2,481.4 | -2,615.2 |
| Capital Expenditure, % | -5.31 | -8.29 | -13.94 | -7.99 | -4.01 | -7.91 | -7.91 | -7.91 | -7.91 | -7.91 |
| Tax Rate, % | 45.12 | 45.12 | 45.12 | 45.12 | 45.12 | 45.12 | 45.12 | 45.12 | 45.12 | 45.12 |
| EBITAT | 1,317.7 | 1,431.1 | 1,920.5 | 2,093.8 | 1,654.0 | 1,985.4 | 2,092.4 | 2,205.3 | 2,324.3 | 2,449.6 |
| Depreciation | ||||||||||
| Changes in Account Receivables | ||||||||||
| Changes in Inventories | ||||||||||
| Changes in Accounts Payable | ||||||||||
| Capital Expenditure | ||||||||||
| UFCF | -6,750.2 | -488.4 | -189.1 | -796.2 | 295.3 | 1,188.4 | 203.8 | 214.8 | 226.4 | 238.6 |
| WACC, % | 5.06 | 5.16 | 5.27 | 5.18 | 5.11 | 5.16 | 5.16 | 5.16 | 5.16 | 5.16 |
| PV UFCF | ||||||||||
| SUM PV UFCF | 1,869.8 | |||||||||
| Long Term Growth Rate, % | 2.00 | |||||||||
| Free cash flow (T + 1) | 243 | |||||||||
| Terminal Value | 7,710 | |||||||||
| Present Terminal Value | 5,997 | |||||||||
| Enterprise Value | 7,866 | |||||||||
| Net Debt | 4,499 | |||||||||
| Equity Value | 3,368 | |||||||||
| Diluted Shares Outstanding, MM | 1,622 | |||||||||
| Equity Value Per Share | 2.08 |
What You Will Receive
- Flexible Forecast Inputs: Easily adjust assumptions (growth %, margins, WACC) to generate various scenarios.
- Real-Life Data: Humanwell Healthcare’s financial information pre-loaded to facilitate your analysis.
- Automated DCF Outputs: The template computes Net Present Value (NPV) and intrinsic value automatically.
- Professional and Customizable: A refined Excel model tailored to meet your valuation requirements.
- Designed for Analysts and Investors: Perfect for evaluating projections, validating strategies, and saving time.
Core Attributes
- Genuine Humanwell Financials: Gain access to reliable pre-loaded historical data and future forecasts.
- Adaptable Forecast Parameters: Modify yellow-highlighted cells such as WACC, growth rates, and profit margins.
- Real-Time Calculations: Instant updates to DCF, Net Present Value (NPV), and cash flow metrics.
- User-Friendly Dashboard: Intuitive charts and summaries for a clear visualization of your valuation insights.
- Designed for All Skill Levels: A streamlined, user-friendly structure tailored for investors, CFOs, and consultants alike.
How It Functions
- Download: Get the pre-prepared Excel file containing Humanwell Healthcare's (600079SS) financial data.
- Customize: Modify forecasts, such as revenue growth, EBITDA %, and WACC to fit your analysis.
- Real-Time Updates: Enjoy automatic updates for intrinsic value and NPV calculations as you make changes.
- Scenario Testing: Generate various projections and quickly compare the results.
- Informed Decisions: Leverage the valuation outcomes to shape your investment strategy.
Why Opt for This Calculator?
- User-Friendly: Tailored for both novices and seasoned professionals.
- Customizable Inputs: Effortlessly adjust parameters to suit your analysis.
- Real-Time Feedback: Observe dynamic updates to Humanwell Healthcare's valuation as you tweak the inputs.
- Preloaded Data: Comes equipped with Humanwell Healthcare's actual financial information for swift assessments.
- Endorsed by Experts: Utilized by investors and analysts for making well-informed decisions.
Who Should Utilize This Product?
- Individual Investors: Gain clarity on making informed decisions regarding Humanwell Healthcare (Group) Co.,Ltd. (600079SS) stock trades.
- Financial Analysts: Enhance valuation workflows with comprehensive financial models tailored for Humanwell Healthcare (Group) Co.,Ltd. (600079SS).
- Consultants: Provide clients with accurate and prompt valuation insights specific to Humanwell Healthcare (Group) Co.,Ltd. (600079SS).
- Business Owners: Learn how major companies like Humanwell Healthcare (Group) Co.,Ltd. (600079SS) are valued to inform your own business strategies.
- Finance Students: Explore valuation methodologies through real-world applications and data related to Humanwell Healthcare (Group) Co.,Ltd. (600079SS).
Contents of the Template
- Pre-Filled Data: Contains Humanwell Healthcare's historical financials and projections.
- Discounted Cash Flow Model: An editable DCF valuation model featuring automatic calculations.
- Weighted Average Cost of Capital (WACC): A dedicated sheet for computing WACC based on customized inputs.
- Key Financial Ratios: Evaluate Humanwell Healthcare's profitability, efficiency, and leverage metrics.
- Customizable Inputs: Easily modify revenue growth, margins, and tax rates.
- User-Friendly Dashboard: Visual representations and tables summarizing essential valuation outcomes.
Disclaimer
All information, articles, and product details provided on this website are for general informational and educational purposes only. We do not claim any ownership over, nor do we intend to infringe upon, any trademarks, copyrights, logos, brand names, or other intellectual property mentioned or depicted on this site. Such intellectual property remains the property of its respective owners, and any references here are made solely for identification or informational purposes, without implying any affiliation, endorsement, or partnership.
We make no representations or warranties, express or implied, regarding the accuracy, completeness, or suitability of any content or products presented. Nothing on this website should be construed as legal, tax, investment, financial, medical, or other professional advice. In addition, no part of this site—including articles or product references—constitutes a solicitation, recommendation, endorsement, advertisement, or offer to buy or sell any securities, franchises, or other financial instruments, particularly in jurisdictions where such activity would be unlawful.
All content is of a general nature and may not address the specific circumstances of any individual or entity. It is not a substitute for professional advice or services. Any actions you take based on the information provided here are strictly at your own risk. You accept full responsibility for any decisions or outcomes arising from your use of this website and agree to release us from any liability in connection with your use of, or reliance upon, the content or products found herein.