
|
Guangzhou Development Group Incorporated (600098.SS) DCF -Bewertung |
Fully Editable: Tailor To Your Needs In Excel Or Sheets
Professional Design: Trusted, Industry-Standard Templates
Investor-Approved Valuation Models
MAC/PC Compatible, Fully Unlocked
No Expertise Is Needed; Easy To Follow
Guangzhou Development Group Incorporated (600098.SS) Bundle
Entdecken Sie die finanzielle Zukunft der Guangzhou Development Group Incorporated (600098SS) mit unserem benutzerfreundlichen DCF-Taschenrechner! Geben Sie Ihre Annahmen für Wachstum, Margen und Kosten für die Berechnung des inneren Werts der Guangzhou -Entwicklungsgruppe Incorporated (600098S) ein und verbessern Sie Ihre Anlagestrategie.
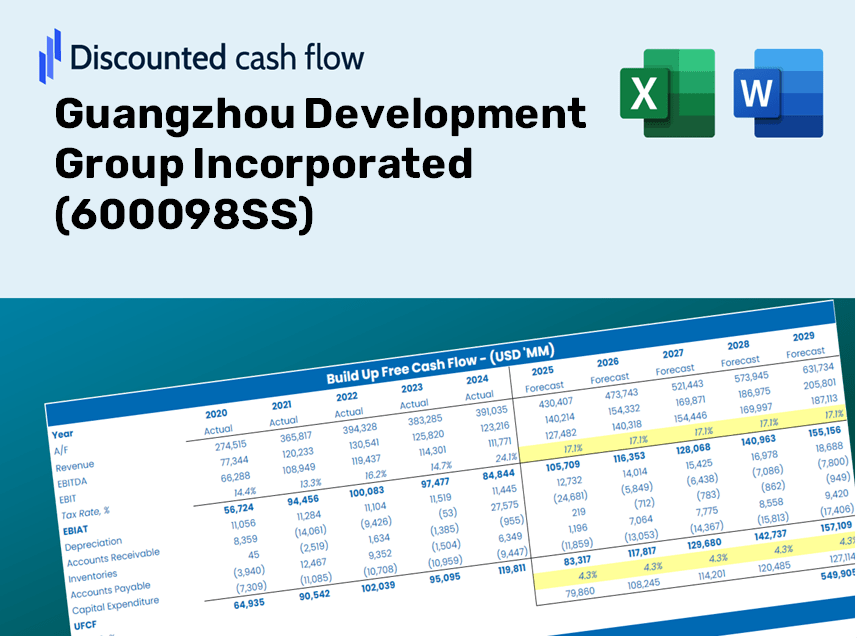
Discounted Cash Flow (DCF) - (USD MM)
| Year | AY1 2020 |
AY2 2021 |
AY3 2022 |
AY4 2023 |
AY5 2024 |
FY1 2025 |
FY2 2026 |
FY3 2027 |
FY4 2028 |
FY5 2029 |
|---|---|---|---|---|---|---|---|---|---|---|
| Revenue | 31,710.5 | 37,952.6 | 47,909.8 | 46,797.4 | 48,328.4 | 53,991.4 | 60,317.8 | 67,385.6 | 75,281.6 | 84,102.8 |
| Revenue Growth, % | 0 | 19.68 | 26.24 | -2.32 | 3.27 | 11.72 | 11.72 | 11.72 | 11.72 | 11.72 |
| EBITDA | 2,882.3 | 1,388.9 | 3,470.2 | 4,856.7 | 5,417.5 | 4,489.9 | 5,016.0 | 5,603.8 | 6,260.4 | 6,994.0 |
| EBITDA, % | 9.09 | 3.66 | 7.24 | 10.38 | 11.21 | 8.32 | 8.32 | 8.32 | 8.32 | 8.32 |
| Depreciation | 1,280.3 | 1,413.3 | 1,485.9 | 1,731.8 | 2,280.5 | 2,082.2 | 2,326.1 | 2,598.7 | 2,903.2 | 3,243.4 |
| Depreciation, % | 4.04 | 3.72 | 3.1 | 3.7 | 4.72 | 3.86 | 3.86 | 3.86 | 3.86 | 3.86 |
| EBIT | 1,602.0 | -24.4 | 1,984.3 | 3,124.9 | 3,136.9 | 2,407.8 | 2,689.9 | 3,005.1 | 3,357.2 | 3,750.6 |
| EBIT, % | 5.05 | -0.06432943 | 4.14 | 6.68 | 6.49 | 4.46 | 4.46 | 4.46 | 4.46 | 4.46 |
| Total Cash | 3,555.4 | 10,437.0 | 7,673.1 | 6,931.1 | 5,089.6 | 8,646.2 | 9,659.3 | 10,791.1 | 12,055.6 | 13,468.2 |
| Total Cash, percent | .0 | .0 | .0 | .0 | .0 | .0 | .0 | .0 | .0 | .0 |
| Account Receivables | 2,329.2 | 2,880.5 | 5,178.8 | -8.7 | 4,466.6 | 3,775.9 | 4,218.4 | 4,712.7 | 5,264.9 | 5,881.8 |
| Account Receivables, % | 7.35 | 7.59 | 10.81 | -0.01857089 | 9.24 | 6.99 | 6.99 | 6.99 | 6.99 | 6.99 |
| Inventories | 2,461.2 | 1,667.7 | 1,499.4 | 1,687.2 | 2,067.4 | 2,501.8 | 2,794.9 | 3,122.4 | 3,488.3 | 3,897.0 |
| Inventories, % | 7.76 | 4.39 | 3.13 | 3.61 | 4.28 | 4.63 | 4.63 | 4.63 | 4.63 | 4.63 |
| Accounts Payable | 2,479.0 | 2,585.4 | 2,707.6 | 6,432.2 | 6,868.2 | 5,208.8 | 5,819.2 | 6,501.0 | 7,262.8 | 8,113.8 |
| Accounts Payable, % | 7.82 | 6.81 | 5.65 | 13.74 | 14.21 | 9.65 | 9.65 | 9.65 | 9.65 | 9.65 |
| Capital Expenditure | -1,964.5 | -3,153.4 | -4,686.0 | -4,319.3 | -3,954.5 | -4,502.6 | -5,030.1 | -5,619.6 | -6,278.0 | -7,013.7 |
| Capital Expenditure, % | -6.2 | -8.31 | -9.78 | -9.23 | -8.18 | -8.34 | -8.34 | -8.34 | -8.34 | -8.34 |
| Tax Rate, % | 27.36 | 27.36 | 27.36 | 27.36 | 27.36 | 27.36 | 27.36 | 27.36 | 27.36 | 27.36 |
| EBITAT | 1,074.4 | 12.0 | 1,819.9 | 2,209.0 | 2,278.7 | 1,454.8 | 1,625.3 | 1,815.7 | 2,028.5 | 2,266.2 |
| Depreciation | ||||||||||
| Changes in Account Receivables | ||||||||||
| Changes in Inventories | ||||||||||
| Changes in Accounts Payable | ||||||||||
| Capital Expenditure | ||||||||||
| UFCF | -1,921.2 | -1,379.5 | -3,388.0 | 8,345.8 | -3,814.7 | -2,368.7 | -1,204.0 | -1,345.1 | -1,502.7 | -1,678.7 |
| WACC, % | 3.86 | 2.55 | 4.34 | 3.93 | 3.97 | 3.73 | 3.73 | 3.73 | 3.73 | 3.73 |
| PV UFCF | ||||||||||
| SUM PV UFCF | -7,303.7 | |||||||||
| Long Term Growth Rate, % | 2.00 | |||||||||
| Free cash flow (T + 1) | -1,712 | |||||||||
| Terminal Value | -99,087 | |||||||||
| Present Terminal Value | -82,516 | |||||||||
| Enterprise Value | -89,819 | |||||||||
| Net Debt | 21,816 | |||||||||
| Equity Value | -111,636 | |||||||||
| Diluted Shares Outstanding, MM | 3,506 | |||||||||
| Equity Value Per Share | -31.84 |
What You Will Receive
- Authentic Guangzhou Data: Comprehensive financials – from revenue to EBIT – derived from actual and projected metrics.
- Complete Customization: Modify all essential variables (yellow cells) such as WACC, growth %, and tax rates.
- Immediate Valuation Adjustments: Automatic recalculations to assess the effects of changes on the fair value of Guangzhou Development Group Incorporated (600098SS).
- Flexible Excel Template: Designed for quick modifications, scenario analysis, and in-depth forecasts.
- Efficient and Precise: Avoid the hassle of creating models from the ground up while ensuring accuracy and adaptability.
Key Features
- Comprehensive DCF Calculator: Features detailed unlevered and levered Discounted Cash Flow valuation models.
- WACC Calculator: Comes with a pre-configured Weighted Average Cost of Capital sheet that offers customizable inputs.
- Adjustable Forecast Assumptions: Allows you to change growth rates, capital expenditures, and discount rates as needed.
- Integrated Financial Ratios: Evaluate profitability, leverage, and efficiency ratios specifically for Guangzhou Development Group Incorporated (600098SS).
- Interactive Dashboard and Charts: Visual representations provide a summary of key valuation metrics for straightforward analysis.
How It Operates
- Download the Template: Gain immediate access to the Excel-based GDG DCF Calculator for Guangzhou Development Group Incorporated (600098SS).
- Input Your Assumptions: Modify the yellow-highlighted fields for growth rates, WACC, margins, and other parameters.
- Instant Calculations: The model automatically recalculates the intrinsic value of Guangzhou Development Group Incorporated (600098SS).
- Test Scenarios: Experiment with various assumptions to assess potential changes in valuation.
- Analyze and Decide: Utilize the results to inform your investment or financial strategies.
Why Opt for This Calculator?
- User-Friendly: Tailored for both novices and seasoned professionals.
- Customizable Inputs: Adjust variables effortlessly to suit your analysis needs.
- Real-Time Results: Observe immediate updates to Guangzhou Development Group Incorporated’s valuation as you modify inputs.
- Pre-configured: Comes loaded with Guangzhou Development Group Incorporated's (600098SS) actual financial data for swift evaluations.
- Relied Upon by Experts: Utilized by investors and analysts for making informed financial choices.
Who Should Benefit from This Product?
- Individual Investors: Make informed choices regarding buying or selling shares of Guangzhou Development Group Incorporated (600098SS).
- Financial Analysts: Enhance your valuation processes with ready-made financial models tailored for this company.
- Consultants: Provide clients with precise and timely valuation insights related to Guangzhou Development Group Incorporated (600098SS).
- Business Owners: Gain an understanding of how major corporations like Guangzhou Development Group Incorporated (600098SS) are valued to inform your own business strategies.
- Finance Students: Explore valuation methods through the lens of real-world data and case studies involving Guangzhou Development Group Incorporated (600098SS).
Components of the Template
- Operating and Balance Sheet Data: Pre-filled historical data and projections for Guangzhou Development Group Incorporated (600098SS), including metrics such as revenue, EBITDA, EBIT, and capital expenditures.
- WACC Calculation: A dedicated worksheet for calculating Weighted Average Cost of Capital (WACC), featuring inputs like Beta, risk-free rate, and stock price.
- DCF Valuation (Unlevered and Levered): Customizable Discounted Cash Flow models that illustrate intrinsic value with comprehensive calculations.
- Financial Statements: Pre-loaded annual and quarterly financial statements to facilitate in-depth analysis.
- Key Ratios: Comprehensive overview of profitability, leverage, and efficiency ratios for Guangzhou Development Group Incorporated (600098SS).
- Dashboard and Charts: A visual representation of valuation results and assumptions, designed for easy analysis of outcomes.
Disclaimer
All information, articles, and product details provided on this website are for general informational and educational purposes only. We do not claim any ownership over, nor do we intend to infringe upon, any trademarks, copyrights, logos, brand names, or other intellectual property mentioned or depicted on this site. Such intellectual property remains the property of its respective owners, and any references here are made solely for identification or informational purposes, without implying any affiliation, endorsement, or partnership.
We make no representations or warranties, express or implied, regarding the accuracy, completeness, or suitability of any content or products presented. Nothing on this website should be construed as legal, tax, investment, financial, medical, or other professional advice. In addition, no part of this site—including articles or product references—constitutes a solicitation, recommendation, endorsement, advertisement, or offer to buy or sell any securities, franchises, or other financial instruments, particularly in jurisdictions where such activity would be unlawful.
All content is of a general nature and may not address the specific circumstances of any individual or entity. It is not a substitute for professional advice or services. Any actions you take based on the information provided here are strictly at your own risk. You accept full responsibility for any decisions or outcomes arising from your use of this website and agree to release us from any liability in connection with your use of, or reliance upon, the content or products found herein.