
|
Chongqing Road & Bridge Co., Ltd (600106.SS) DCF -Bewertung |
Fully Editable: Tailor To Your Needs In Excel Or Sheets
Professional Design: Trusted, Industry-Standard Templates
Investor-Approved Valuation Models
MAC/PC Compatible, Fully Unlocked
No Expertise Is Needed; Easy To Follow
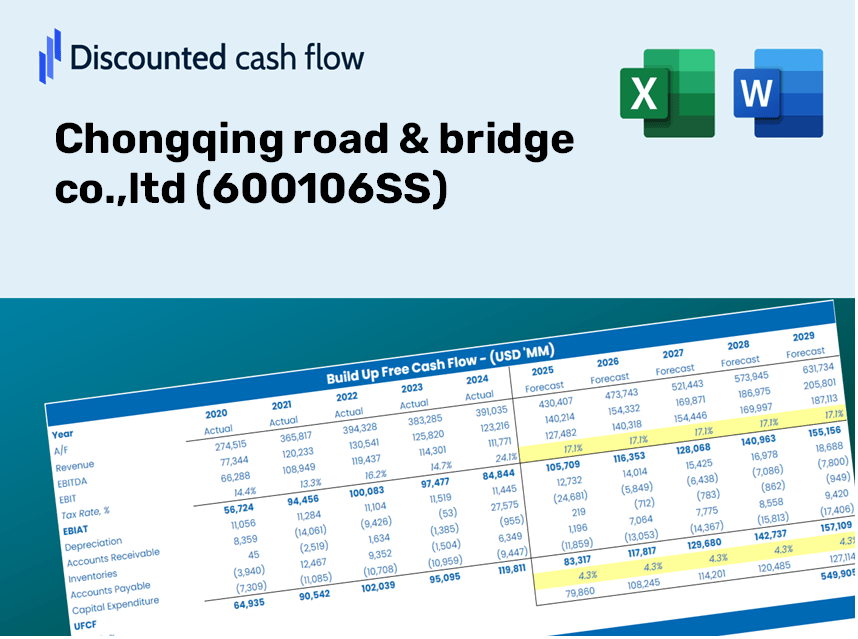
Chongqing road & bridge co.,ltd (600106.SS) Bundle
Erforschen Sie das finanzielle Potenzial der Chongqing Road & Bridge Co., Ltd. mit unserem benutzerfreundlichen DCF-Taschenrechner! Geben Sie Ihre Projektionen für Wachstum, Margen und Kosten ein, um den inneren Wert der Chongqing Road zu berechnen & Bridge Co., Ltd. (600106S) und verfeinern Sie Ihren Investitionsansatz.
Discounted Cash Flow (DCF) - (USD MM)
| Year | AY1 2020 |
AY2 2021 |
AY3 2022 |
AY4 2023 |
AY5 2024 |
FY1 2025 |
FY2 2026 |
FY3 2027 |
FY4 2028 |
FY5 2029 |
|---|---|---|---|---|---|---|---|---|---|---|
| Revenue | 201.7 | 164.8 | 121.3 | 116.7 | 113.0 | 98.4 | 85.7 | 74.7 | 65.0 | 56.6 |
| Revenue Growth, % | 0 | -18.32 | -26.37 | -3.79 | -3.16 | -12.91 | -12.91 | -12.91 | -12.91 | -12.91 |
| EBITDA | 165.7 | 127.1 | 89.6 | 78.5 | 74.1 | 72.0 | 62.7 | 54.6 | 47.6 | 41.4 |
| EBITDA, % | 82.14 | 77.14 | 73.82 | 67.26 | 65.55 | 73.18 | 73.18 | 73.18 | 73.18 | 73.18 |
| Depreciation | 14.3 | 14.3 | 5.0 | 5.1 | 3.8 | 5.4 | 4.7 | 4.1 | 3.6 | 3.1 |
| Depreciation, % | 7.08 | 8.66 | 4.16 | 4.33 | 3.35 | 5.51 | 5.51 | 5.51 | 5.51 | 5.51 |
| EBIT | 151.4 | 112.8 | 84.5 | 73.5 | 70.3 | 66.6 | 58.0 | 50.5 | 44.0 | 38.3 |
| EBIT, % | 75.06 | 68.48 | 69.66 | 62.93 | 62.21 | 67.67 | 67.67 | 67.67 | 67.67 | 67.67 |
| Total Cash | 1,795.7 | 1,965.8 | 1,906.7 | 1,615.3 | 1,620.3 | 98.4 | 85.7 | 74.7 | 65.0 | 56.6 |
| Total Cash, percent | .0 | .0 | .0 | .0 | .0 | .0 | .0 | .0 | .0 | .0 |
| Account Receivables | .6 | 18.4 | 9.8 | 14.2 | 46.8 | 14.4 | 12.5 | 10.9 | 9.5 | 8.3 |
| Account Receivables, % | 0.29664 | 11.19 | 8.07 | 12.18 | 41.42 | 14.63 | 14.63 | 14.63 | 14.63 | 14.63 |
| Inventories | 352.9 | 354.2 | 355.3 | 356.5 | 359.1 | 98.4 | 85.7 | 74.7 | 65.0 | 56.6 |
| Inventories, % | 174.92 | 214.95 | 292.86 | 305.41 | 317.65 | 100 | 100 | 100 | 100 | 100 |
| Accounts Payable | 2.3 | 2.3 | 1.8 | 3.4 | 2.3 | 1.7 | 1.5 | 1.3 | 1.2 | 1.0 |
| Accounts Payable, % | 1.14 | 1.39 | 1.46 | 2.89 | 1.99 | 1.78 | 1.78 | 1.78 | 1.78 | 1.78 |
| Capital Expenditure | -.1 | .0 | -.1 | .0 | .0 | .0 | .0 | .0 | .0 | .0 |
| Capital Expenditure, % | -0.03849037 | -0.0106511 | -0.04181683 | -0.01313915 | -0.00506904 | -0.0218333 | -0.0218333 | -0.0218333 | -0.0218333 | -0.0218333 |
| Tax Rate, % | 9.2 | 9.2 | 9.2 | 9.2 | 9.2 | 9.2 | 9.2 | 9.2 | 9.2 | 9.2 |
| EBITAT | 115.6 | 108.1 | 76.7 | 67.4 | 63.8 | 59.3 | 51.7 | 45.0 | 39.2 | 34.1 |
| Depreciation | ||||||||||
| Changes in Account Receivables | ||||||||||
| Changes in Inventories | ||||||||||
| Changes in Accounts Payable | ||||||||||
| Capital Expenditure | ||||||||||
| UFCF | -221.4 | 103.2 | 88.7 | 68.4 | 31.3 | 357.3 | 70.7 | 61.6 | 53.6 | 46.7 |
| WACC, % | 5.67 | 5.81 | 5.77 | 5.78 | 5.77 | 5.76 | 5.76 | 5.76 | 5.76 | 5.76 |
| PV UFCF | ||||||||||
| SUM PV UFCF | 531.3 | |||||||||
| Long Term Growth Rate, % | 4.00 | |||||||||
| Free cash flow (T + 1) | 49 | |||||||||
| Terminal Value | 2,761 | |||||||||
| Present Terminal Value | 2,087 | |||||||||
| Enterprise Value | 2,618 | |||||||||
| Net Debt | 65 | |||||||||
| Equity Value | 2,553 | |||||||||
| Diluted Shares Outstanding, MM | 1,329 | |||||||||
| Equity Value Per Share | 1.92 |
Benefits of Using Our Service
- Editable Forecast Variables: Customize assumptions (growth %, margins, WACC) to explore various scenarios.
- Accurate Financial Data: Pre-loaded financial information for Chongqing Road & Bridge Co., Ltd (600106SS) to facilitate your analysis.
- Automated DCF Calculations: The model computes Net Present Value (NPV) and intrinsic value automatically.
- Customizable and Professional Design: A sleek Excel template that meets your valuation requirements.
- Designed for Analysts and Investors: Perfect for assessing projections, verifying strategies, and enhancing efficiency.
Key Features
- Comprehensive DCF Calculator: Provides detailed unlevered and levered DCF valuation models tailored for Chongqing Road & Bridge Co., Ltd (600106SS).
- WACC Calculator: Features a pre-configured Weighted Average Cost of Capital sheet with options for custom inputs.
- Customizable Forecast Parameters: Adjust growth projections, capital investments, and discount rates as needed.
- Integrated Financial Ratios: Evaluate profitability, debt, and efficiency ratios specific to Chongqing Road & Bridge Co., Ltd (600106SS).
- Interactive Dashboard and Visualizations: Graphical representations present essential valuation metrics for straightforward analysis.
How It Works
- Step 1: Download the Excel file.
- Step 2: Review Chongqing Road & Bridge Co., Ltd.'s (600106SS) pre-filled financial data and forecasts.
- Step 3: Adjust key inputs such as revenue growth, WACC, and tax rates (highlighted cells).
- Step 4: Observe the DCF model update in real time as you modify the assumptions.
- Step 5: Evaluate the outputs and leverage the results for your investment strategies.
Why Opt for Chongqing Road & Bridge Co., Ltd. (600106SS)?
- Reliability: Backed by solid financials to ensure reliable data.
- Adaptability: Tailored for users to easily adjust and analyze inputs.
- Efficiency: Eliminate the complexities of constructing models from the ground up.
- Expert-Level: Crafted with the precision and usability expected at the executive level.
- Intuitive: User-friendly interface designed for individuals at all experience levels.
Who Can Benefit from This Product?
- Investors: Assess the valuation of Chongqing Road & Bridge Co., Ltd (600106SS) before making investment decisions.
- CFOs and Financial Analysts: Optimize valuation approaches and validate financial projections.
- Startup Founders: Gain insights into how large public companies like Chongqing Road & Bridge Co., Ltd (600106SS) are appraised.
- Consultants: Provide expert valuation analyses and reports for your clients.
- Students and Educators: Utilize real-world data to enhance valuation skills and knowledge in educational settings.
Contents of the Template
- Preloaded CQR Data: Historical and projected financial metrics, including revenue, EBIT, and capital investments.
- DCF and WACC Models: Advanced spreadsheets for determining intrinsic value and Weighted Average Cost of Capital.
- Editable Inputs: Yellow-highlighted fields for modifying revenue growth, tax rates, and discount rates.
- Financial Statements: Detailed annual and quarterly financial reports for in-depth analysis.
- Key Ratios: Profitability, leverage, and efficiency ratios for performance evaluation.
- Dashboard and Charts: Visual representations of valuation results and underlying assumptions.
Disclaimer
All information, articles, and product details provided on this website are for general informational and educational purposes only. We do not claim any ownership over, nor do we intend to infringe upon, any trademarks, copyrights, logos, brand names, or other intellectual property mentioned or depicted on this site. Such intellectual property remains the property of its respective owners, and any references here are made solely for identification or informational purposes, without implying any affiliation, endorsement, or partnership.
We make no representations or warranties, express or implied, regarding the accuracy, completeness, or suitability of any content or products presented. Nothing on this website should be construed as legal, tax, investment, financial, medical, or other professional advice. In addition, no part of this site—including articles or product references—constitutes a solicitation, recommendation, endorsement, advertisement, or offer to buy or sell any securities, franchises, or other financial instruments, particularly in jurisdictions where such activity would be unlawful.
All content is of a general nature and may not address the specific circumstances of any individual or entity. It is not a substitute for professional advice or services. Any actions you take based on the information provided here are strictly at your own risk. You accept full responsibility for any decisions or outcomes arising from your use of this website and agree to release us from any liability in connection with your use of, or reliance upon, the content or products found herein.