
|
NBTM New Materials Group Co., Ltd. (600114.Sss) DCF -Bewertung |
Fully Editable: Tailor To Your Needs In Excel Or Sheets
Professional Design: Trusted, Industry-Standard Templates
Investor-Approved Valuation Models
MAC/PC Compatible, Fully Unlocked
No Expertise Is Needed; Easy To Follow
NBTM New Materials Group Co., Ltd. (600114.SS) Bundle
Vereinfachen Sie die NBTM New Materials Group Co., Ltd. (600114SS) Bewertung mit diesem anpassbaren DCF -Taschenrechner! Mit Real NBTM New Materials Group Co., Ltd. (600114SS) Finanzdaten und einstellbaren Prognoseeingängen können Sie die Szenarien testen und NBTM New Materials Group Co., Ltd. (600114SS) in Protokollen aufdecken.
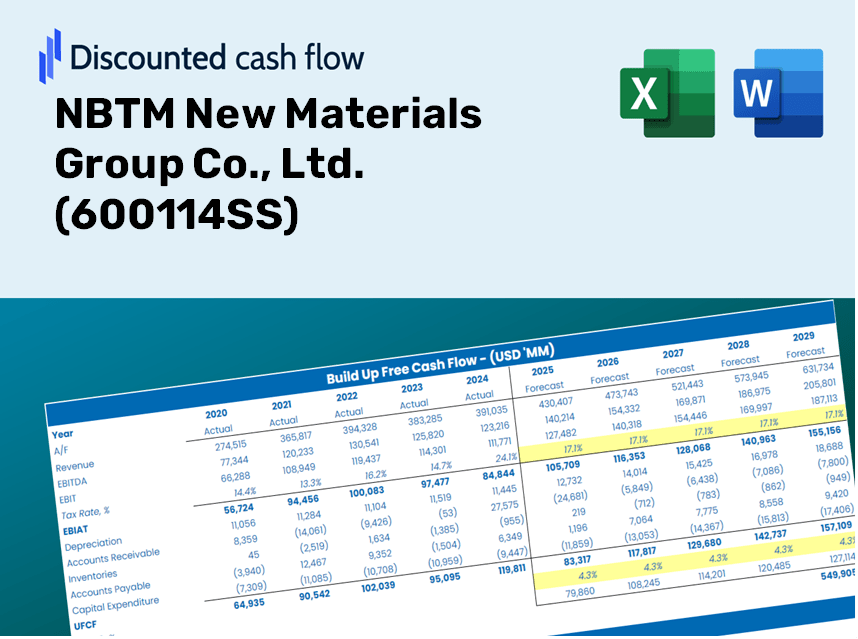
Discounted Cash Flow (DCF) - (USD MM)
| Year | AY1 2020 |
AY2 2021 |
AY3 2022 |
AY4 2023 |
AY5 2024 |
FY1 2025 |
FY2 2026 |
FY3 2027 |
FY4 2028 |
FY5 2029 |
|---|---|---|---|---|---|---|---|---|---|---|
| Revenue | 3,283.5 | 3,591.3 | 3,726.3 | 3,861.1 | 5,143.0 | 5,785.2 | 6,507.7 | 7,320.4 | 8,234.6 | 9,262.9 |
| Revenue Growth, % | 0 | 9.38 | 3.76 | 3.62 | 33.2 | 12.49 | 12.49 | 12.49 | 12.49 | 12.49 |
| EBITDA | 454.4 | 452.1 | 543.4 | 603.1 | 906.0 | 859.1 | 966.4 | 1,087.0 | 1,222.8 | 1,375.5 |
| EBITDA, % | 13.84 | 12.59 | 14.58 | 15.62 | 17.62 | 14.85 | 14.85 | 14.85 | 14.85 | 14.85 |
| Depreciation | 272.2 | 299.4 | 315.3 | 350.6 | 342.6 | 472.4 | 531.4 | 597.8 | 672.4 | 756.4 |
| Depreciation, % | 8.29 | 8.34 | 8.46 | 9.08 | 6.66 | 8.17 | 8.17 | 8.17 | 8.17 | 8.17 |
| EBIT | 182.1 | 152.6 | 228.2 | 252.6 | 563.5 | 386.7 | 435.0 | 489.3 | 550.4 | 619.1 |
| EBIT, % | 5.55 | 4.25 | 6.12 | 6.54 | 10.96 | 6.68 | 6.68 | 6.68 | 6.68 | 6.68 |
| Total Cash | 447.8 | 367.1 | 340.9 | 257.4 | 317.5 | 530.5 | 596.8 | 671.3 | 755.1 | 849.4 |
| Total Cash, percent | .0 | .0 | .0 | .0 | .0 | .0 | .0 | .0 | .0 | .0 |
| Account Receivables | 1,208.3 | 1,123.2 | 1,115.4 | 1,330.9 | 1,730.5 | 1,922.1 | 2,162.2 | 2,432.2 | 2,735.9 | 3,077.6 |
| Account Receivables, % | 36.8 | 31.28 | 29.93 | 34.47 | 33.65 | 33.22 | 33.22 | 33.22 | 33.22 | 33.22 |
| Inventories | 588.1 | 755.9 | 900.1 | 909.6 | 1,204.7 | 1,273.8 | 1,432.9 | 1,611.9 | 1,813.1 | 2,039.6 |
| Inventories, % | 17.91 | 21.05 | 24.15 | 23.56 | 23.42 | 22.02 | 22.02 | 22.02 | 22.02 | 22.02 |
| Accounts Payable | 436.3 | 349.8 | 369.6 | 221.9 | 698.8 | 605.0 | 680.5 | 765.5 | 861.1 | 968.6 |
| Accounts Payable, % | 13.29 | 9.74 | 9.92 | 5.75 | 13.59 | 10.46 | 10.46 | 10.46 | 10.46 | 10.46 |
| Capital Expenditure | -394.3 | -470.4 | -242.3 | -253.4 | -236.8 | -494.9 | -556.7 | -626.3 | -704.5 | -792.5 |
| Capital Expenditure, % | -12.01 | -13.1 | -6.5 | -6.56 | -4.6 | -8.56 | -8.56 | -8.56 | -8.56 | -8.56 |
| Tax Rate, % | 17.07 | 17.07 | 17.07 | 17.07 | 17.07 | 17.07 | 17.07 | 17.07 | 17.07 | 17.07 |
| EBITAT | 127.4 | 110.3 | 230.3 | 249.8 | 467.3 | 327.9 | 368.9 | 414.9 | 466.7 | 525.0 |
| Depreciation | ||||||||||
| Changes in Account Receivables | ||||||||||
| Changes in Inventories | ||||||||||
| Changes in Accounts Payable | ||||||||||
| Capital Expenditure | ||||||||||
| UFCF | -1,354.7 | -230.0 | 186.7 | -25.7 | 355.2 | -49.3 | 20.0 | 22.5 | 25.3 | 28.4 |
| WACC, % | 5.06 | 5.07 | 5.22 | 5.21 | 5.13 | 5.14 | 5.14 | 5.14 | 5.14 | 5.14 |
| PV UFCF | ||||||||||
| SUM PV UFCF | 33.3 | |||||||||
| Long Term Growth Rate, % | 4.00 | |||||||||
| Free cash flow (T + 1) | 30 | |||||||||
| Terminal Value | 2,599 | |||||||||
| Present Terminal Value | 2,023 | |||||||||
| Enterprise Value | 2,057 | |||||||||
| Net Debt | 2,108 | |||||||||
| Equity Value | -52 | |||||||||
| Diluted Shares Outstanding, MM | 616 | |||||||||
| Equity Value Per Share | -0.08 |
What You Will Receive
- Customizable Excel Template: A fully adjustable Excel-based DCF Calculator featuring pre-filled financial data for NBTM New Materials Group Co., Ltd. (600114SS).
- Real-Time Data: Access to historical performance metrics and future projections (indicated in the highlighted cells).
- Flexible Forecasting: Modify assumptions such as revenue growth, EBITDA margin, and WACC as needed.
- Instant Calculations: See how your adjustments affect the valuation of NBTM New Materials Group Co., Ltd. (600114SS) in real time.
- Professional Resource: Designed for investors, financial officers, consultants, and analysts.
- Intuitive Interface: Organized for ease of understanding and navigation, complete with clear, step-by-step guidance.
Key Features
- Real-Life NBTM Data: Pre-filled with NBTM New Materials Group Co., Ltd.'s historical financials and future projections.
- Fully Customizable Inputs: Adjust revenue growth, profit margins, WACC, tax rates, and capital expenditures.
- Dynamic Valuation Model: Automatic updates to Net Present Value (NPV) and intrinsic value based on your adjustments.
- Scenario Testing: Develop various forecast scenarios to evaluate different valuation results.
- User-Friendly Design: Intuitive, organized, and tailored for both professionals and newcomers.
How It Functions
- Step 1: Download the ready-to-use Excel template featuring NBTM New Materials Group Co., Ltd.'s (600114SS) data.
- Step 2: Navigate through the filled sheets to grasp the essential metrics.
- Step 3: Adjust forecasts and assumptions in the editable yellow cells (WACC, growth, margins).
- Step 4: Immediately view updated results, including NBTM New Materials Group Co., Ltd.’s (600114SS) intrinsic value.
- Step 5: Make educated investment choices or create reports based on the outputs.
Why Choose NBTM New Materials Group Co., Ltd. (600114SS)?
- Time-Saving Solution: Jump straight into analysis without the hassle of building a model from the ground up.
- Enhanced Accuracy: Utilize trustworthy financial data and formulas to minimize valuation errors.
- Complete Customization: Adapt the model to suit your unique assumptions and forecasts.
- User-Friendly Design: Intuitive charts and outputs facilitate straightforward analysis of results.
- Endorsed by Industry Professionals: Crafted for experts who prioritize both precision and ease of use.
Who Can Benefit from NBTM New Materials Group Co., Ltd.?
- Individual Investors: Gain insights for making informed decisions on buying or selling NBTM stock (600114SS).
- Financial Analysts: Simplify valuation tasks with comprehensive financial models tailored for NBTM.
- Consultants: Provide clients with accurate and timely valuation analysis for NBTM.
- Business Owners: Learn about the valuation strategies of leading companies like NBTM to inform your own business approach.
- Finance Students: Explore valuation methodologies utilizing real-world data from NBTM (600114SS) and practical case studies.
Contents of the Template
- Preloaded NBTM Data: Historical and projected financial metrics, including revenue, EBIT, and capital expenditures.
- DCF and WACC Models: Sophisticated sheets for determining intrinsic value and Weighted Average Cost of Capital.
- Editable Inputs: Yellow-highlighted cells for modifying revenue growth, tax rates, and discount rates.
- Financial Statements: Detailed annual and quarterly financial reports for in-depth analysis.
- Key Ratios: Metrics for profitability, leverage, and efficiency to assess overall performance.
- Dashboard and Charts: Visual representations of valuation results and underlying assumptions.
Disclaimer
All information, articles, and product details provided on this website are for general informational and educational purposes only. We do not claim any ownership over, nor do we intend to infringe upon, any trademarks, copyrights, logos, brand names, or other intellectual property mentioned or depicted on this site. Such intellectual property remains the property of its respective owners, and any references here are made solely for identification or informational purposes, without implying any affiliation, endorsement, or partnership.
We make no representations or warranties, express or implied, regarding the accuracy, completeness, or suitability of any content or products presented. Nothing on this website should be construed as legal, tax, investment, financial, medical, or other professional advice. In addition, no part of this site—including articles or product references—constitutes a solicitation, recommendation, endorsement, advertisement, or offer to buy or sell any securities, franchises, or other financial instruments, particularly in jurisdictions where such activity would be unlawful.
All content is of a general nature and may not address the specific circumstances of any individual or entity. It is not a substitute for professional advice or services. Any actions you take based on the information provided here are strictly at your own risk. You accept full responsibility for any decisions or outcomes arising from your use of this website and agree to release us from any liability in connection with your use of, or reliance upon, the content or products found herein.