
|
China CSSC Holdings Limited (600150.SS) DCF -Bewertung |
Fully Editable: Tailor To Your Needs In Excel Or Sheets
Professional Design: Trusted, Industry-Standard Templates
Investor-Approved Valuation Models
MAC/PC Compatible, Fully Unlocked
No Expertise Is Needed; Easy To Follow
China CSSC Holdings Limited (600150.SS) Bundle
Entdecken Sie das wahre Potenzial von China CSSC Holdings Limited (600150SS) mit unserem fortschrittlichen DCF -Taschenrechner! Passen Sie die entscheidenden Annahmen an, erkunden Sie verschiedene Szenarien und bewerten Sie, wie Veränderungen die Bewertung von China CSSC Holdings Limited (600150S) beeinflussen - alles innerhalb einer bequemen Excel -Vorlage.
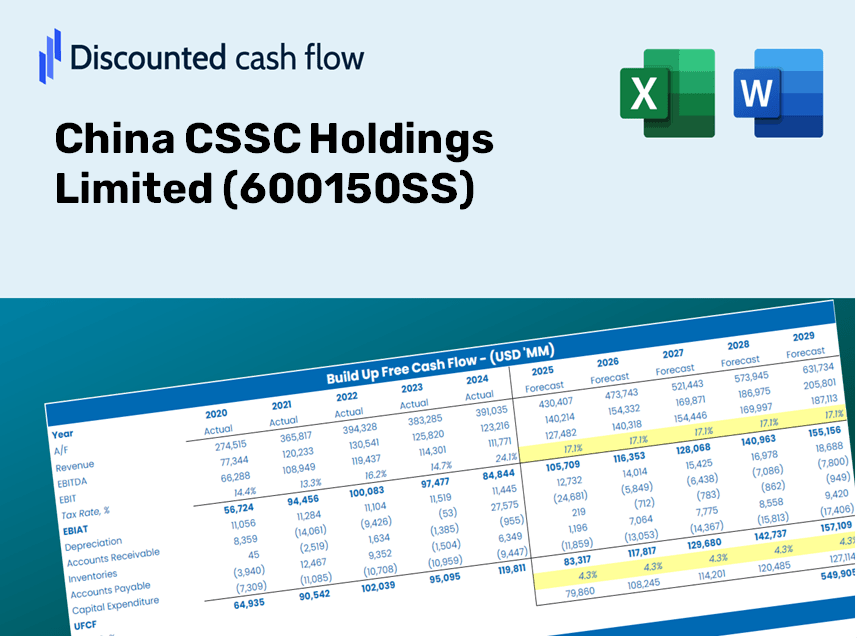
Discounted Cash Flow (DCF) - (USD MM)
| Year | AY1 2020 |
AY2 2021 |
AY3 2022 |
AY4 2023 |
AY5 2024 |
FY1 2025 |
FY2 2026 |
FY3 2027 |
FY4 2028 |
FY5 2029 |
|---|---|---|---|---|---|---|---|---|---|---|
| Revenue | 55,243.5 | 59,740.4 | 59,557.7 | 74,838.5 | 78,584.4 | 86,147.5 | 94,438.5 | 103,527.4 | 113,491.1 | 124,413.6 |
| Revenue Growth, % | 0 | 8.14 | -0.3058 | 25.66 | 5.01 | 9.62 | 9.62 | 9.62 | 9.62 | 9.62 |
| EBITDA | 2,922.5 | 3,200.5 | 5,297.9 | 5,599.8 | 6,591.6 | 6,101.5 | 6,688.7 | 7,332.5 | 8,038.2 | 8,811.8 |
| EBITDA, % | 5.29 | 5.36 | 8.9 | 7.48 | 8.39 | 7.08 | 7.08 | 7.08 | 7.08 | 7.08 |
| Depreciation | 2,184.3 | 2,165.6 | 2,407.7 | 2,521.9 | 2,169.5 | 3,058.6 | 3,353.0 | 3,675.7 | 4,029.4 | 4,417.2 |
| Depreciation, % | 3.95 | 3.63 | 4.04 | 3.37 | 2.76 | 3.55 | 3.55 | 3.55 | 3.55 | 3.55 |
| EBIT | 738.2 | 1,034.8 | 2,890.2 | 3,077.9 | 4,422.0 | 3,042.9 | 3,335.8 | 3,656.8 | 4,008.7 | 4,394.6 |
| EBIT, % | 1.34 | 1.73 | 4.85 | 4.11 | 5.63 | 3.53 | 3.53 | 3.53 | 3.53 | 3.53 |
| Total Cash | 52,139.9 | 55,729.2 | 57,594.5 | 67,966.7 | 63,680.9 | 78,605.1 | 86,170.2 | 94,463.4 | 103,554.7 | 113,521.0 |
| Total Cash, percent | .0 | .0 | .0 | .0 | .0 | .0 | .0 | .0 | .0 | .0 |
| Account Receivables | 6,817.7 | 12,678.3 | 10,736.9 | 7,306.0 | 8,649.1 | 12,467.2 | 13,667.0 | 14,982.4 | 16,424.3 | 18,005.0 |
| Account Receivables, % | 12.34 | 21.22 | 18.03 | 9.76 | 11.01 | 14.47 | 14.47 | 14.47 | 14.47 | 14.47 |
| Inventories | 31,365.9 | 32,687.0 | 32,168.0 | 36,290.9 | 35,815.4 | 44,723.0 | 49,027.2 | 53,745.6 | 58,918.2 | 64,588.6 |
| Inventories, % | 56.78 | 54.72 | 54.01 | 48.49 | 45.58 | 51.91 | 51.91 | 51.91 | 51.91 | 51.91 |
| Accounts Payable | 26,437.3 | 29,711.4 | 27,021.4 | 26,578.8 | 30,112.7 | 37,352.5 | 40,947.4 | 44,888.3 | 49,208.4 | 53,944.3 |
| Accounts Payable, % | 47.86 | 49.73 | 45.37 | 35.51 | 38.32 | 43.36 | 43.36 | 43.36 | 43.36 | 43.36 |
| Capital Expenditure | -2,102.9 | -1,180.0 | -1,429.7 | -2,421.8 | -1,642.3 | -2,327.4 | -2,551.4 | -2,797.0 | -3,066.1 | -3,361.2 |
| Capital Expenditure, % | -3.81 | -1.98 | -2.4 | -3.24 | -2.09 | -2.7 | -2.7 | -2.7 | -2.7 | -2.7 |
| Tax Rate, % | 11.83 | 11.83 | 11.83 | 11.83 | 11.83 | 11.83 | 11.83 | 11.83 | 11.83 | 11.83 |
| EBITAT | 726.5 | 674.1 | 1,160.3 | 3,011.8 | 3,899.1 | 2,371.8 | 2,600.1 | 2,850.3 | 3,124.6 | 3,425.3 |
| Depreciation | ||||||||||
| Changes in Account Receivables | ||||||||||
| Changes in Inventories | ||||||||||
| Changes in Accounts Payable | ||||||||||
| Capital Expenditure | ||||||||||
| UFCF | -10,938.4 | -2,247.8 | 1,908.6 | 1,977.3 | 7,092.6 | -2,382.8 | 1,492.4 | 1,636.0 | 1,793.5 | 1,966.1 |
| WACC, % | 6.15 | 6.06 | 5.99 | 6.15 | 6.12 | 6.1 | 6.1 | 6.1 | 6.1 | 6.1 |
| PV UFCF | ||||||||||
| SUM PV UFCF | 3,327.7 | |||||||||
| Long Term Growth Rate, % | 3.50 | |||||||||
| Free cash flow (T + 1) | 2,035 | |||||||||
| Terminal Value | 78,355 | |||||||||
| Present Terminal Value | 58,284 | |||||||||
| Enterprise Value | 61,612 | |||||||||
| Net Debt | -51,515 | |||||||||
| Equity Value | 113,127 | |||||||||
| Diluted Shares Outstanding, MM | 4,462 | |||||||||
| Equity Value Per Share | 25.35 |
What You Will Receive
- Customizable Excel Template: A fully adjustable Excel-based DCF Calculator featuring pre-filled financial data for China CSSC Holdings Limited (600150SS).
- Authentic Data: Historical performance data and forward-looking estimates (highlighted in the yellow cells).
- Adjustable Forecasts: Modify key assumptions such as revenue growth, EBITDA margin, and WACC.
- Instant Calculations: Quickly assess how your inputs influence the valuation of China CSSC Holdings Limited (600150SS).
- Professional Tool: Designed for investors, CFOs, consultants, and financial analysts alike.
- User-Friendly Layout: Organized for simplicity and ease of navigation, with clear step-by-step instructions.
Key Features
- Comprehensive DCF Calculator: Offers detailed unlevered and levered DCF valuation models tailored for China CSSC Holdings Limited (600150SS).
- WACC Calculator: Comes with a pre-configured Weighted Average Cost of Capital sheet featuring customizable inputs.
- Adjustable Forecast Assumptions: Easily modify growth rates, capital expenditures, and discount rates to suit your analysis.
- Integrated Financial Ratios: Assess profitability, leverage, and efficiency ratios specifically for China CSSC Holdings Limited (600150SS).
- Interactive Dashboard and Charts: Provides visual representations to summarize key valuation metrics for straightforward analysis.
How It Functions
- Step 1: Download the Excel file.
- Step 2: Review the pre-filled data for China CSSC Holdings Limited (600150SS) covering both historical and projected figures.
- Step 3: Modify key assumptions (yellow cells) according to your analysis.
- Step 4: Observe the automatic recalculations for the intrinsic value of China CSSC Holdings Limited (600150SS).
- Step 5: Utilize the results for making investment decisions or for reporting purposes.
Why Opt for This Calculator?
- Precise Information: Accurate financial data from China CSSC Holdings Limited (600150SS) provides trustworthy valuation outcomes.
- Flexible Options: Tailor critical variables such as growth rates, WACC, and tax rates to fit your forecasts.
- Efficiency Boost: Built-in calculations save time and eliminate the need to start from the ground up.
- High-Caliber Tool: Specifically crafted for investors, analysts, and consultants.
- Easy to Use: User-friendly design and clear, step-by-step guidance ensure accessibility for all users.
Who Should Consider This Product?
- Individual Investors: Make well-informed decisions regarding the purchase or sale of China CSSC Holdings Limited (600150SS) shares.
- Financial Analysts: Optimize valuation efforts with ready-to-use financial models tailored for China CSSC Holdings Limited (600150SS).
- Consultants: Provide clients with accurate and timely valuation insights related to China CSSC Holdings Limited (600150SS).
- Business Owners: Gain insights into the valuation of large corporations like China CSSC Holdings Limited (600150SS) to inform your own business strategies.
- Finance Students: Master valuation methodologies using real-world data and case studies focused on China CSSC Holdings Limited (600150SS).
Contents of the Template
- Pre-Filled Data: Contains China CSSC Holdings Limited's historical financial information and forecasts.
- Discounted Cash Flow Model: Interactive DCF valuation model featuring automatic calculations.
- Weighted Average Cost of Capital (WACC): A specific sheet dedicated to calculating WACC with customizable inputs.
- Key Financial Ratios: Evaluate China CSSC Holdings Limited's profitability, efficiency, and leverage.
- Customizable Inputs: Easily modify revenue growth rates, profit margins, and tax rates.
- Clear Dashboard: Visual representations in the form of charts and tables summarizing essential valuation outcomes.
Disclaimer
All information, articles, and product details provided on this website are for general informational and educational purposes only. We do not claim any ownership over, nor do we intend to infringe upon, any trademarks, copyrights, logos, brand names, or other intellectual property mentioned or depicted on this site. Such intellectual property remains the property of its respective owners, and any references here are made solely for identification or informational purposes, without implying any affiliation, endorsement, or partnership.
We make no representations or warranties, express or implied, regarding the accuracy, completeness, or suitability of any content or products presented. Nothing on this website should be construed as legal, tax, investment, financial, medical, or other professional advice. In addition, no part of this site—including articles or product references—constitutes a solicitation, recommendation, endorsement, advertisement, or offer to buy or sell any securities, franchises, or other financial instruments, particularly in jurisdictions where such activity would be unlawful.
All content is of a general nature and may not address the specific circumstances of any individual or entity. It is not a substitute for professional advice or services. Any actions you take based on the information provided here are strictly at your own risk. You accept full responsibility for any decisions or outcomes arising from your use of this website and agree to release us from any liability in connection with your use of, or reliance upon, the content or products found herein.