
|
China Sports Industry Group Co., Ltd. (600158.SS) DCF -Bewertung |
Fully Editable: Tailor To Your Needs In Excel Or Sheets
Professional Design: Trusted, Industry-Standard Templates
Investor-Approved Valuation Models
MAC/PC Compatible, Fully Unlocked
No Expertise Is Needed; Easy To Follow
China Sports Industry Group Co., Ltd. (600158.SS) Bundle
Bewerten Sie die finanziellen Aussichten der China Sports Industry Group Co., Ltd. (600158S) mit Expertenpräzision! Dieser (600158SS) DCF-Taschenrechner ist mit vorgefüllten Finanzdaten ausgestattet und bietet vollständige Flexibilität, um das Umsatzwachstum, WACC, Margen und andere kritische Annahmen zu ändern, um sich an Ihren Projektionen auszurichten.
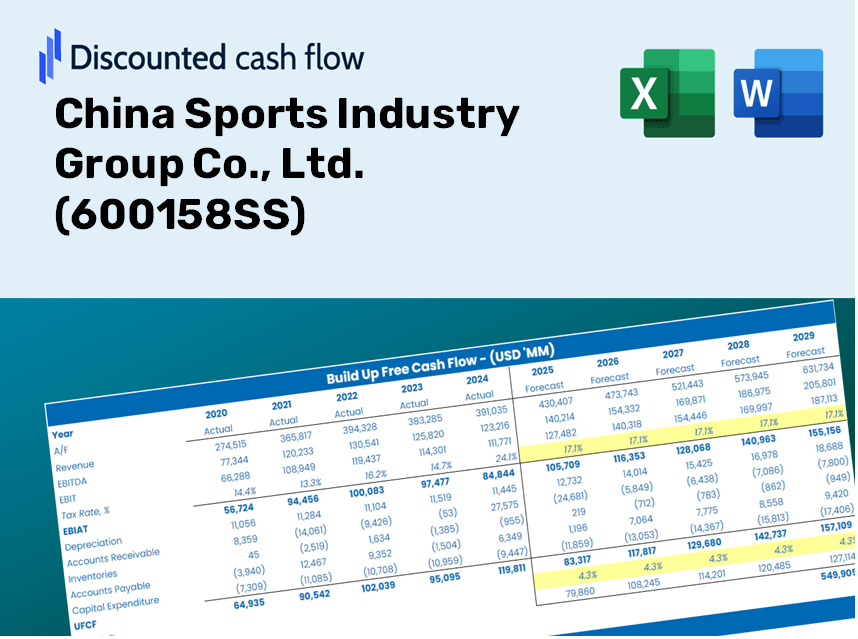
Discounted Cash Flow (DCF) - (USD MM)
| Year | AY1 2020 |
AY2 2021 |
AY3 2022 |
AY4 2023 |
AY5 2024 |
FY1 2025 |
FY2 2026 |
FY3 2027 |
FY4 2028 |
FY5 2029 |
|---|---|---|---|---|---|---|---|---|---|---|
| Revenue | 1,996.3 | 1,515.1 | 1,431.5 | 3,811.5 | 2,517.8 | 2,747.2 | 2,997.4 | 3,270.4 | 3,568.3 | 3,893.3 |
| Revenue Growth, % | 0 | -24.11 | -5.52 | 166.27 | -33.94 | 9.11 | 9.11 | 9.11 | 9.11 | 9.11 |
| EBITDA | 190.2 | 150.1 | 103.5 | 624.9 | 265.2 | 294.4 | 321.3 | 350.5 | 382.5 | 417.3 |
| EBITDA, % | 9.53 | 9.9 | 7.23 | 16.39 | 10.53 | 10.72 | 10.72 | 10.72 | 10.72 | 10.72 |
| Depreciation | 51.9 | 59.7 | 66.5 | 69.2 | 70.7 | 86.9 | 94.8 | 103.4 | 112.8 | 123.1 |
| Depreciation, % | 2.6 | 3.94 | 4.65 | 1.81 | 2.81 | 3.16 | 3.16 | 3.16 | 3.16 | 3.16 |
| EBIT | 138.3 | 90.3 | 37.0 | 555.7 | 194.4 | 207.6 | 226.5 | 247.1 | 269.6 | 294.2 |
| EBIT, % | 6.93 | 5.96 | 2.59 | 14.58 | 7.72 | 7.56 | 7.56 | 7.56 | 7.56 | 7.56 |
| Total Cash | 2,064.7 | 1,898.8 | 2,827.2 | 2,411.8 | 2,097.9 | 2,453.8 | 2,677.3 | 2,921.1 | 3,187.2 | 3,477.5 |
| Total Cash, percent | .0 | .0 | .0 | .0 | .0 | .0 | .0 | .0 | .0 | .0 |
| Account Receivables | 402.6 | 587.9 | 220.2 | 1,068.6 | 1,006.8 | 782.3 | 853.5 | 931.3 | 1,016.1 | 1,108.6 |
| Account Receivables, % | 20.17 | 38.81 | 15.38 | 28.04 | 39.99 | 28.48 | 28.48 | 28.48 | 28.48 | 28.48 |
| Inventories | 1,497.8 | 1,550.8 | 1,855.5 | 1,610.5 | 1,334.1 | 2,034.4 | 2,219.7 | 2,421.8 | 2,642.4 | 2,883.1 |
| Inventories, % | 75.03 | 102.36 | 129.62 | 42.25 | 52.99 | 74.05 | 74.05 | 74.05 | 74.05 | 74.05 |
| Accounts Payable | 462.9 | 382.7 | 325.6 | 554.4 | 543.1 | 589.6 | 643.3 | 701.9 | 765.8 | 835.5 |
| Accounts Payable, % | 23.19 | 25.26 | 22.74 | 14.54 | 21.57 | 21.46 | 21.46 | 21.46 | 21.46 | 21.46 |
| Capital Expenditure | -62.2 | -120.6 | -122.1 | -75.1 | -73.5 | -134.6 | -146.8 | -160.2 | -174.8 | -190.7 |
| Capital Expenditure, % | -3.12 | -7.96 | -8.53 | -1.97 | -2.92 | -4.9 | -4.9 | -4.9 | -4.9 | -4.9 |
| Tax Rate, % | 77.2 | 77.2 | 77.2 | 77.2 | 77.2 | 77.2 | 77.2 | 77.2 | 77.2 | 77.2 |
| EBITAT | 40.2 | 38.4 | 5.1 | 68.1 | 44.3 | 50.0 | 54.5 | 59.5 | 64.9 | 70.9 |
| Depreciation | ||||||||||
| Changes in Account Receivables | ||||||||||
| Changes in Inventories | ||||||||||
| Changes in Accounts Payable | ||||||||||
| Capital Expenditure | ||||||||||
| UFCF | -1,407.6 | -341.0 | -44.5 | -312.5 | 368.4 | -426.9 | -200.4 | -218.6 | -238.5 | -260.2 |
| WACC, % | 5.33 | 5.36 | 5.29 | 5.29 | 5.31 | 5.31 | 5.31 | 5.31 | 5.31 | 5.31 |
| PV UFCF | ||||||||||
| SUM PV UFCF | -1,168.0 | |||||||||
| Long Term Growth Rate, % | 3.50 | |||||||||
| Free cash flow (T + 1) | -269 | |||||||||
| Terminal Value | -14,843 | |||||||||
| Present Terminal Value | -11,457 | |||||||||
| Enterprise Value | -12,625 | |||||||||
| Net Debt | -1,946 | |||||||||
| Equity Value | -10,679 | |||||||||
| Diluted Shares Outstanding, MM | 960 | |||||||||
| Equity Value Per Share | -11.12 |
Benefits You Will Receive
- Comprehensive (600158SS) Financials: Access to historical and projected data for precise valuation.
- Customizable Inputs: Adjust WACC, tax rates, revenue growth, and capital expenditures as needed.
- Automated Calculations: Real-time calculations of intrinsic value and NPV.
- Scenario Analysis: Explore various scenarios to assess the future performance of China Sports Industry Group Co., Ltd.
- User-Friendly Design: Designed for professionals while remaining approachable for newcomers.
Key Features
- Comprehensive DCF Calculator: Offers in-depth unlevered and levered DCF valuation models tailored for China Sports Industry Group Co., Ltd. (600158SS).
- WACC Calculation Tool: Provides a pre-designed Weighted Average Cost of Capital framework with adjustable parameters.
- Customizable Forecast Inputs: Easily adjust growth projections, capital expenditures, and discount rates.
- Integrated Financial Ratios: Evaluate profitability, leverage, and efficiency metrics specific to China Sports Industry Group Co., Ltd. (600158SS).
- User-Friendly Dashboard and Visuals: Visual representations that condense essential valuation indicators for streamlined analysis.
How It Functions
- Download: Obtain the pre-prepared Excel file featuring financial data for China Sports Industry Group Co., Ltd. (600158SS).
- Customize: Modify forecasts, including revenue growth, EBITDA %, and WACC.
- Update Automatically: The intrinsic value and NPV calculations refresh in real-time.
- Test Scenarios: Generate various projections and instantly compare the results.
- Make Decisions: Utilize the valuation insights to inform your investment strategy.
Why Opt for China Sports Industry Group Co., Ltd. (600158SS)?
- Save Time: No need to start from scratch – our resources are ready for immediate use.
- Enhance Accuracy: Our reliable financial data and formulas minimize valuation errors.
- Fully Customizable: Adjust the model to align with your own assumptions and forecasts.
- Easy to Analyze: Intuitive charts and outputs simplify the interpretation of results.
- Trusted by Industry Leaders: Created for professionals who prioritize precision and ease of use.
Who Can Benefit from This Product?
- Sports Management Students: Discover industry-specific valuation methods and implement them using current data on China Sports Industry Group Co., Ltd. (600158SS).
- Researchers: Utilize established models in your academic projects related to sports economics and business.
- Investors: Evaluate your own hypotheses and review valuation results for China Sports Industry Group Co., Ltd. (600158SS).
- Financial Analysts: Enhance your analysis process with a ready-to-use, adaptable DCF model tailored for the sports industry.
- Entrepreneurs: Understand how major companies like China Sports Industry Group Co., Ltd. (600158SS) are valued and analyzed in the marketplace.
Contents of the Template
- Historical Data: Contains past financial information and baseline forecasts for China Sports Industry Group Co., Ltd. (600158SS).
- DCF and Levered DCF Models: Comprehensive templates designed for calculating the intrinsic value of China Sports Industry Group Co., Ltd. (600158SS).
- WACC Sheet: Pre-configured calculations for the Weighted Average Cost of Capital.
- Editable Inputs: Customize essential parameters such as growth rates, EBITDA %, and CAPEX assumptions.
- Quarterly and Annual Statements: Thorough breakdown of the financials for China Sports Industry Group Co., Ltd. (600158SS).
- Interactive Dashboard: Dynamically visualize valuation outcomes and projections.
Disclaimer
All information, articles, and product details provided on this website are for general informational and educational purposes only. We do not claim any ownership over, nor do we intend to infringe upon, any trademarks, copyrights, logos, brand names, or other intellectual property mentioned or depicted on this site. Such intellectual property remains the property of its respective owners, and any references here are made solely for identification or informational purposes, without implying any affiliation, endorsement, or partnership.
We make no representations or warranties, express or implied, regarding the accuracy, completeness, or suitability of any content or products presented. Nothing on this website should be construed as legal, tax, investment, financial, medical, or other professional advice. In addition, no part of this site—including articles or product references—constitutes a solicitation, recommendation, endorsement, advertisement, or offer to buy or sell any securities, franchises, or other financial instruments, particularly in jurisdictions where such activity would be unlawful.
All content is of a general nature and may not address the specific circumstances of any individual or entity. It is not a substitute for professional advice or services. Any actions you take based on the information provided here are strictly at your own risk. You accept full responsibility for any decisions or outcomes arising from your use of this website and agree to release us from any liability in connection with your use of, or reliance upon, the content or products found herein.