
|
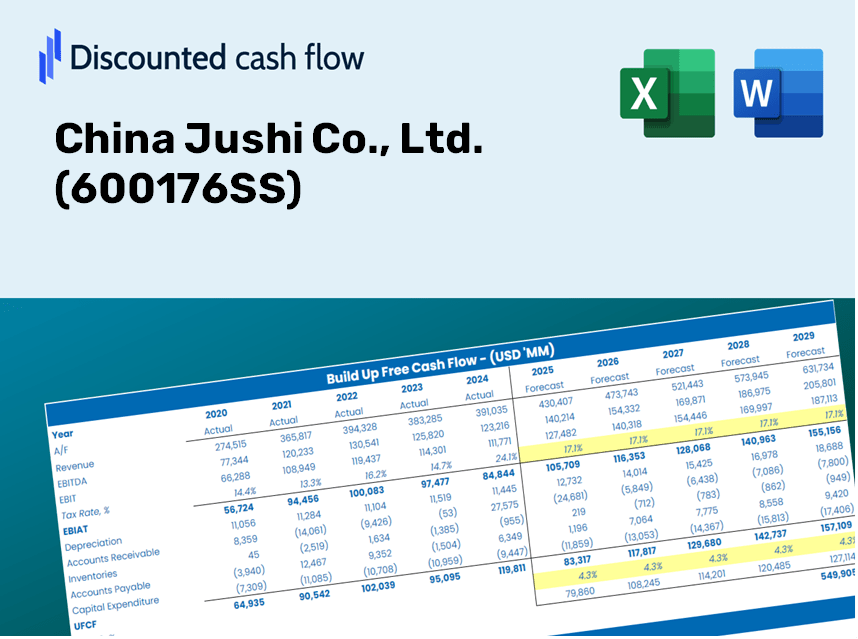
China Jushi Co., Ltd. (600176.SS) DCF -Bewertung |
Fully Editable: Tailor To Your Needs In Excel Or Sheets
Professional Design: Trusted, Industry-Standard Templates
Investor-Approved Valuation Models
MAC/PC Compatible, Fully Unlocked
No Expertise Is Needed; Easy To Follow
China Jushi Co., Ltd. (600176.SS) Bundle
Unsere China Jushi Co., Ltd. (600176S) DCF-Rechner wurde für die Genauigkeit entwickelt und befördert Sie, die Bewertung des Unternehmens anhand von Finanzdaten mit realer Welt zu bewerten. Dies bietet vollständige Flexibilität, um alle wesentlichen Parameter für erweiterte Projektionen zu ändern.
Discounted Cash Flow (DCF) - (USD MM)
| Year | AY1 2020 |
AY2 2021 |
AY3 2022 |
AY4 2023 |
AY5 2024 |
FY1 2025 |
FY2 2026 |
FY3 2027 |
FY4 2028 |
FY5 2029 |
|---|---|---|---|---|---|---|---|---|---|---|
| Revenue | 11,666.2 | 19,706.9 | 20,192.2 | 14,875.8 | 15,855.8 | 17,902.9 | 20,214.4 | 22,824.3 | 25,771.1 | 29,098.5 |
| Revenue Growth, % | 0 | 68.92 | 2.46 | -26.33 | 6.59 | 12.91 | 12.91 | 12.91 | 12.91 | 12.91 |
| EBITDA | 4,033.6 | 8,507.4 | 7,371.7 | 4,653.6 | 5,054.1 | 6,352.4 | 7,172.5 | 8,098.6 | 9,144.2 | 10,324.8 |
| EBITDA, % | 34.58 | 43.17 | 36.51 | 31.28 | 31.88 | 35.48 | 35.48 | 35.48 | 35.48 | 35.48 |
| Depreciation | 1,273.4 | 1,806.8 | 1,733.1 | 2,059.7 | 2,232.0 | 2,026.2 | 2,287.8 | 2,583.2 | 2,916.7 | 3,293.3 |
| Depreciation, % | 10.92 | 9.17 | 8.58 | 13.85 | 14.08 | 11.32 | 11.32 | 11.32 | 11.32 | 11.32 |
| EBIT | 2,760.2 | 6,700.7 | 5,638.6 | 2,593.9 | 2,822.1 | 4,326.1 | 4,884.7 | 5,515.3 | 6,227.4 | 7,031.5 |
| EBIT, % | 23.66 | 34 | 27.92 | 17.44 | 17.8 | 24.16 | 24.16 | 24.16 | 24.16 | 24.16 |
| Total Cash | 1,900.7 | 3,318.5 | 2,640.0 | 3,130.1 | 3,123.3 | 3,113.2 | 3,515.1 | 3,968.9 | 4,481.4 | 5,060.0 |
| Total Cash, percent | .0 | .0 | .0 | .0 | .0 | .0 | .0 | .0 | .0 | .0 |
| Account Receivables | 6,205.9 | 8,216.3 | 4,857.8 | 3,870.9 | 4,746.7 | 6,262.6 | 7,071.2 | 7,984.2 | 9,015.0 | 10,178.9 |
| Account Receivables, % | 53.2 | 41.69 | 24.06 | 26.02 | 29.94 | 34.98 | 34.98 | 34.98 | 34.98 | 34.98 |
| Inventories | 1,580.0 | 2,199.3 | 4,128.7 | 4,533.1 | 4,203.4 | 3,657.0 | 4,129.1 | 4,662.2 | 5,264.2 | 5,943.8 |
| Inventories, % | 13.54 | 11.16 | 20.45 | 30.47 | 26.51 | 20.43 | 20.43 | 20.43 | 20.43 | 20.43 |
| Accounts Payable | 2,023.5 | 2,390.1 | 2,803.0 | 1,642.6 | 2,862.4 | 2,594.1 | 2,929.0 | 3,307.2 | 3,734.2 | 4,216.3 |
| Accounts Payable, % | 17.34 | 12.13 | 13.88 | 11.04 | 18.05 | 14.49 | 14.49 | 14.49 | 14.49 | 14.49 |
| Capital Expenditure | -1,531.7 | -3,655.6 | -5,547.0 | -1,460.0 | -1,302.9 | -2,763.6 | -3,120.4 | -3,523.3 | -3,978.2 | -4,491.8 |
| Capital Expenditure, % | -13.13 | -18.55 | -27.47 | -9.81 | -8.22 | -15.44 | -15.44 | -15.44 | -15.44 | -15.44 |
| Tax Rate, % | 18.59 | 18.59 | 18.59 | 18.59 | 18.59 | 18.59 | 18.59 | 18.59 | 18.59 | 18.59 |
| EBITAT | 2,336.9 | 5,531.4 | 4,636.2 | 2,129.9 | 2,297.5 | 3,573.0 | 4,034.3 | 4,555.2 | 5,143.3 | 5,807.4 |
| Depreciation | ||||||||||
| Changes in Account Receivables | ||||||||||
| Changes in Inventories | ||||||||||
| Changes in Accounts Payable | ||||||||||
| Capital Expenditure | ||||||||||
| UFCF | -3,683.8 | 1,419.4 | 2,664.4 | 2,151.5 | 3,900.3 | 1,597.9 | 2,256.0 | 2,547.2 | 2,876.1 | 3,247.4 |
| WACC, % | 8.03 | 8.02 | 8.02 | 8.02 | 8.01 | 8.02 | 8.02 | 8.02 | 8.02 | 8.02 |
| PV UFCF | ||||||||||
| SUM PV UFCF | 9,754.4 | |||||||||
| Long Term Growth Rate, % | 1.00 | |||||||||
| Free cash flow (T + 1) | 3,280 | |||||||||
| Terminal Value | 46,728 | |||||||||
| Present Terminal Value | 31,774 | |||||||||
| Enterprise Value | 41,529 | |||||||||
| Net Debt | 7,022 | |||||||||
| Equity Value | 34,507 | |||||||||
| Diluted Shares Outstanding, MM | 4,003 | |||||||||
| Equity Value Per Share | 8.62 |
What You Will Receive
- Authentic Jushi Financial Data: Pre-loaded with China Jushi’s historical and projected figures for detailed analysis.
- Fully Customizable Template: Easily adjust key parameters such as revenue growth, WACC, and EBITDA %.
- Instant Calculations: Watch as the intrinsic value of China Jushi updates in real-time with your adjustments.
- Expert Valuation Tool: Tailored for investors, analysts, and consultants looking for reliable DCF outcomes.
- User-Friendly Layout: Intuitive structure and straightforward instructions suitable for all skill levels.
Key Features
- 🔍 Real-Life Jushi Financials: Pre-filled historical and projected data for China Jushi Co., Ltd. (600176SS).
- ✏️ Fully Customizable Inputs: Modify all essential parameters (yellow cells) such as WACC, growth %, and tax rates.
- 📊 Professional DCF Valuation: Integrated formulas compute China Jushi's intrinsic value using the Discounted Cash Flow method.
- ⚡ Instant Results: Visualize the valuation of China Jushi immediately after any adjustments.
- Scenario Analysis: Evaluate and compare the outcomes of different financial assumptions side-by-side.
How It Functions
- Step 1: Download the Excel spreadsheet.
- Step 2: Examine the pre-filled data for China Jushi Co., Ltd. (600176SS) including historical and forecasted figures.
- Step 3: Modify the key assumptions (highlighted in yellow) according to your insights.
- Step 4: Observe automatic updates for the intrinsic value of China Jushi Co., Ltd. (600176SS).
- Step 5: Utilize the results for your investment strategies or reporting needs.
Why Choose This Calculator for China Jushi Co., Ltd. (600176SS)?
- Accurate Data: Utilize real financial figures from China Jushi for dependable valuation outcomes.
- Customizable: Tailor key metrics such as growth rates, WACC, and tax rates to align with your financial forecasts.
- Time-Saving: Pre-configured calculations allow you to bypass the hassle of starting from the ground up.
- Professional-Grade Tool: Crafted for the needs of investors, analysts, and consultants alike.
- User-Friendly: Designed with an intuitive interface and comprehensive instructions to accommodate users of all skill levels.
Who Can Benefit from This Product?
- Investors: Evaluate China Jushi Co., Ltd.'s (600176SS) valuation prior to making investment decisions.
- CFOs and Financial Analysts: Enhance valuation methodologies and validate financial forecasts.
- Startup Founders: Discover how leading public companies like China Jushi Co., Ltd. (600176SS) are appraised.
- Consultants: Provide clients with comprehensive valuation reports for informed decision-making.
- Students and Educators: Utilize authentic data to practice and teach valuation strategies.
Contents of the Template
- Pre-Filled Data: Features China Jushi Co., Ltd.’s historical financials and projections.
- Discounted Cash Flow Model: An editable DCF valuation model with automated calculations.
- Weighted Average Cost of Capital (WACC): A specialized sheet for calculating WACC based on user-defined inputs.
- Key Financial Ratios: Evaluate China Jushi Co., Ltd.’s profitability, efficiency, and financial leverage.
- Customizable Inputs: Easily modify revenue growth, profit margins, and tax rates.
- Clear Dashboard: Visualizations and tables that summarize essential valuation outcomes.
Disclaimer
All information, articles, and product details provided on this website are for general informational and educational purposes only. We do not claim any ownership over, nor do we intend to infringe upon, any trademarks, copyrights, logos, brand names, or other intellectual property mentioned or depicted on this site. Such intellectual property remains the property of its respective owners, and any references here are made solely for identification or informational purposes, without implying any affiliation, endorsement, or partnership.
We make no representations or warranties, express or implied, regarding the accuracy, completeness, or suitability of any content or products presented. Nothing on this website should be construed as legal, tax, investment, financial, medical, or other professional advice. In addition, no part of this site—including articles or product references—constitutes a solicitation, recommendation, endorsement, advertisement, or offer to buy or sell any securities, franchises, or other financial instruments, particularly in jurisdictions where such activity would be unlawful.
All content is of a general nature and may not address the specific circumstances of any individual or entity. It is not a substitute for professional advice or services. Any actions you take based on the information provided here are strictly at your own risk. You accept full responsibility for any decisions or outcomes arising from your use of this website and agree to release us from any liability in connection with your use of, or reliance upon, the content or products found herein.