
|
Spic Yuanda Environmental Protection Co., Ltd. (600292.SS) DCF-Bewertung |
Fully Editable: Tailor To Your Needs In Excel Or Sheets
Professional Design: Trusted, Industry-Standard Templates
Investor-Approved Valuation Models
MAC/PC Compatible, Fully Unlocked
No Expertise Is Needed; Easy To Follow
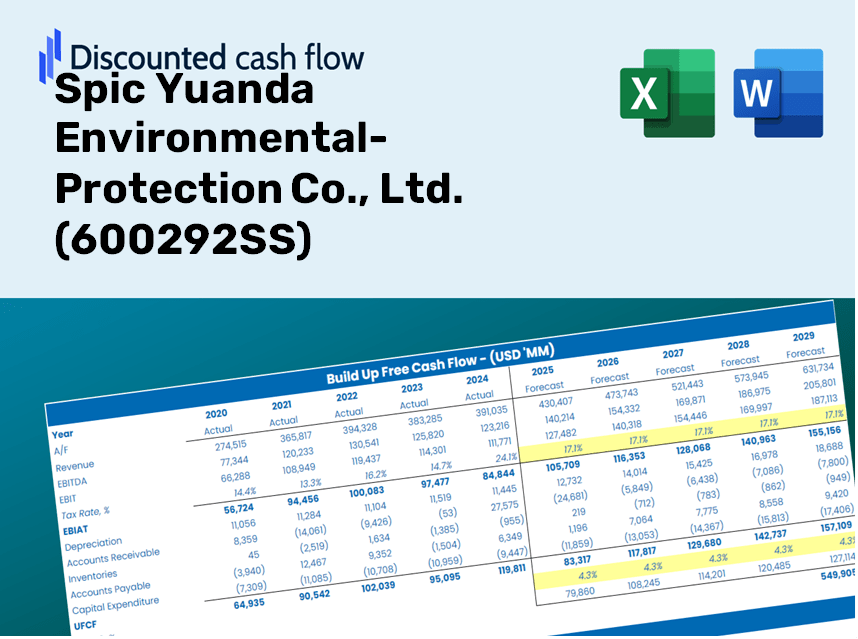
Spic Yuanda Environmental-Protection Co., Ltd. (600292.SS) Bundle
Entdecken Sie die finanzielle Zukunft von Spic Yuanda Environmental Protection Co., Ltd. (600292SS) mit unserem benutzerfreundlichen DCF-Taschenrechner! Geben Sie Ihre Prognosen für Wachstum, Gewinnmargen und Ausgaben ein, um den inneren Wert von Spic Yuanda Environmental-Protection Co., Ltd. (600292S) zu berechnen, und verbessern Sie Ihre Anlagestrategie.
Discounted Cash Flow (DCF) - (USD MM)
| Year | AY1 2020 |
AY2 2021 |
AY3 2022 |
AY4 2023 |
AY5 2024 |
FY1 2025 |
FY2 2026 |
FY3 2027 |
FY4 2028 |
FY5 2029 |
|---|---|---|---|---|---|---|---|---|---|---|
| Revenue | 3,678.2 | 4,442.7 | 4,136.8 | 4,251.6 | 4,722.4 | 5,050.0 | 5,400.3 | 5,774.9 | 6,175.4 | 6,603.8 |
| Revenue Growth, % | 0 | 20.78 | -6.89 | 2.78 | 11.07 | 6.94 | 6.94 | 6.94 | 6.94 | 6.94 |
| EBITDA | 429.8 | 560.5 | 505.4 | 558.8 | 585.2 | 626.7 | 670.2 | 716.7 | 766.4 | 819.6 |
| EBITDA, % | 11.68 | 12.62 | 12.22 | 13.14 | 12.39 | 12.41 | 12.41 | 12.41 | 12.41 | 12.41 |
| Depreciation | 362.9 | 397.2 | 413.8 | 414.6 | 410.2 | 477.2 | 510.3 | 545.7 | 583.5 | 624.0 |
| Depreciation, % | 9.87 | 8.94 | 10 | 9.75 | 8.69 | 9.45 | 9.45 | 9.45 | 9.45 | 9.45 |
| EBIT | 66.9 | 163.3 | 91.6 | 144.2 | 175.0 | 149.5 | 159.9 | 171.0 | 182.9 | 195.6 |
| EBIT, % | 1.82 | 3.68 | 2.22 | 3.39 | 3.71 | 2.96 | 2.96 | 2.96 | 2.96 | 2.96 |
| Total Cash | 454.7 | 440.5 | 600.7 | 712.2 | 606.5 | 670.6 | 717.1 | 766.8 | 820.0 | 876.9 |
| Total Cash, percent | .0 | .0 | .0 | .0 | .0 | .0 | .0 | .0 | .0 | .0 |
| Account Receivables | 2,649.5 | 2,761.9 | 2,950.7 | 2,927.8 | 2,993.5 | 3,411.6 | 3,648.2 | 3,901.3 | 4,171.9 | 4,461.3 |
| Account Receivables, % | 72.03 | 62.17 | 71.33 | 68.86 | 63.39 | 67.56 | 67.56 | 67.56 | 67.56 | 67.56 |
| Inventories | 421.4 | 386.0 | 279.1 | 203.5 | 194.6 | 361.6 | 386.7 | 413.5 | 442.2 | 472.8 |
| Inventories, % | 11.46 | 8.69 | 6.75 | 4.79 | 4.12 | 7.16 | 7.16 | 7.16 | 7.16 | 7.16 |
| Accounts Payable | 1,623.0 | 1,867.4 | 1,935.8 | 1,825.5 | 1,964.1 | 2,196.5 | 2,348.9 | 2,511.8 | 2,686.1 | 2,872.4 |
| Accounts Payable, % | 44.12 | 42.03 | 46.79 | 42.94 | 41.59 | 43.5 | 43.5 | 43.5 | 43.5 | 43.5 |
| Capital Expenditure | -717.7 | -199.8 | -112.5 | -185.9 | -396.5 | -398.9 | -426.6 | -456.2 | -487.8 | -521.7 |
| Capital Expenditure, % | -19.51 | -4.5 | -2.72 | -4.37 | -8.4 | -7.9 | -7.9 | -7.9 | -7.9 | -7.9 |
| Tax Rate, % | 65.46 | 65.46 | 65.46 | 65.46 | 65.46 | 65.46 | 65.46 | 65.46 | 65.46 | 65.46 |
| EBITAT | 23.3 | 83.1 | -126.9 | 81.5 | 60.5 | 52.9 | 56.6 | 60.5 | 64.7 | 69.2 |
| Depreciation | ||||||||||
| Changes in Account Receivables | ||||||||||
| Changes in Inventories | ||||||||||
| Changes in Accounts Payable | ||||||||||
| Capital Expenditure | ||||||||||
| UFCF | -1,779.3 | 447.9 | 160.8 | 298.5 | 156.0 | -221.5 | 30.9 | 33.1 | 35.4 | 37.8 |
| WACC, % | 4.31 | 4.39 | 4.11 | 4.42 | 4.3 | 4.31 | 4.31 | 4.31 | 4.31 | 4.31 |
| PV UFCF | ||||||||||
| SUM PV UFCF | -94.3 | |||||||||
| Long Term Growth Rate, % | 4.00 | |||||||||
| Free cash flow (T + 1) | 39 | |||||||||
| Terminal Value | 12,784 | |||||||||
| Present Terminal Value | 10,353 | |||||||||
| Enterprise Value | 10,259 | |||||||||
| Net Debt | 283 | |||||||||
| Equity Value | 9,976 | |||||||||
| Diluted Shares Outstanding, MM | 719 | |||||||||
| Equity Value Per Share | 13.87 |
What You Will Receive
- Genuine SYD Financials: Access to both historical and projected data for precise valuation.
- Customizable Parameters: Adjust key factors such as WACC, tax rates, revenue growth, and capital expenditures as needed.
- Instant Calculations: Automatically computes intrinsic value and NPV in real-time.
- Scenario Testing: Evaluate various scenarios to assess Spic Yuanda’s potential future performance.
- User-Friendly Interface: Designed for professionals while remaining easy to navigate for newcomers.
Key Features
- Real-Life SYE Data: Pre-filled with Spic Yuanda Environmental-Protection Co., Ltd.'s historical financials and future projections.
- Fully Customizable Inputs: Tailor revenue growth, profit margins, WACC, tax rates, and capital expenditures to your needs.
- Dynamic Valuation Model: Automatically updates Net Present Value (NPV) and intrinsic value based on your inputs.
- Scenario Testing: Construct multiple forecasting scenarios to evaluate different valuation outcomes.
- User-Friendly Design: Intuitive and structured design suitable for both professionals and beginners.
How It Works
- Step 1: Download the Excel file for Spic Yuanda Environmental-Protection Co., Ltd. (600292SS).
- Step 2: Review the pre-filled financial data and forecasts for Spic Yuanda (600292SS).
- Step 3: Adjust key inputs such as revenue growth, WACC, and tax rates (highlighted cells).
- Step 4: Observe the DCF model update in real-time as you modify the assumptions.
- Step 5: Evaluate the results and leverage the findings for your investment strategies.
Why Opt for Spic Yuanda’s Calculator?
- Precision: Utilizes real financial data from Spic Yuanda (600292SS) to ensure reliable outputs.
- Versatility: Created for users to easily adjust inputs and explore various scenarios.
- Efficiency: Avoid the complexities of constructing a DCF model from the ground up.
- Expert-Level: Designed with the accuracy and functionality required by top-tier financial professionals.
- Intuitive: Simple to navigate, making it accessible for users without extensive financial modeling skills.
Who Can Benefit from This Product?
- Environmental Science Students: Explore sustainability practices and analyze data relevant to environmental impact.
- Researchers: Integrate advanced environmental models into your studies and publications.
- Investors: Evaluate your investment strategies and assess the valuation metrics for Spic Yuanda Environmental-Protection Co., Ltd. (600292SS).
- Environmental Analysts: Optimize your research with a customizable DCF model tailored for environmental projects.
- Small Business Entrepreneurs: Understand how large environmental firms like Spic Yuanda are assessed in the market.
Contents of the Template
- Pre-Filled Data: Contains Spic Yuanda Environmental-Protection Co., Ltd.'s historical financials and projections.
- Discounted Cash Flow Model: An editable DCF valuation model featuring automatic calculations.
- Weighted Average Cost of Capital (WACC): A dedicated worksheet for calculating WACC using customizable inputs.
- Key Financial Ratios: Evaluate Spic Yuanda's profitability, efficiency, and financial leverage.
- Customizable Inputs: Easily modify revenue growth rates, margins, and tax percentages.
- Clear Dashboard: Visual representations, including charts and tables that summarize essential valuation outcomes.
Disclaimer
All information, articles, and product details provided on this website are for general informational and educational purposes only. We do not claim any ownership over, nor do we intend to infringe upon, any trademarks, copyrights, logos, brand names, or other intellectual property mentioned or depicted on this site. Such intellectual property remains the property of its respective owners, and any references here are made solely for identification or informational purposes, without implying any affiliation, endorsement, or partnership.
We make no representations or warranties, express or implied, regarding the accuracy, completeness, or suitability of any content or products presented. Nothing on this website should be construed as legal, tax, investment, financial, medical, or other professional advice. In addition, no part of this site—including articles or product references—constitutes a solicitation, recommendation, endorsement, advertisement, or offer to buy or sell any securities, franchises, or other financial instruments, particularly in jurisdictions where such activity would be unlawful.
All content is of a general nature and may not address the specific circumstances of any individual or entity. It is not a substitute for professional advice or services. Any actions you take based on the information provided here are strictly at your own risk. You accept full responsibility for any decisions or outcomes arising from your use of this website and agree to release us from any liability in connection with your use of, or reliance upon, the content or products found herein.