
|
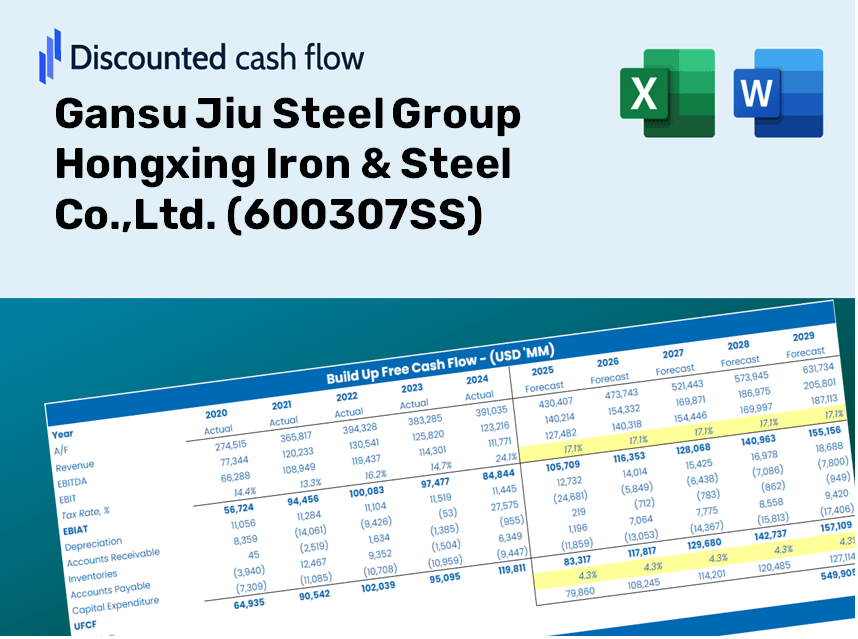
Gansu Jiu Steel Group Hongxing Iron & Steel Co., Ltd. (600307.SS) DCF -Bewertung |
Fully Editable: Tailor To Your Needs In Excel Or Sheets
Professional Design: Trusted, Industry-Standard Templates
Investor-Approved Valuation Models
MAC/PC Compatible, Fully Unlocked
No Expertise Is Needed; Easy To Follow
Gansu Jiu Steel Group Hongxing Iron & Steel Co.,Ltd. (600307.SS) Bundle
Optimieren Sie Ihre Gansu Jiu Steel Group Hongxing Iron & Steel Co., Ltd. (600307S) Bewertungsanalyse unter Verwendung unseres ausgeklügelten DCF -Taschenrechners! Diese Excel -Vorlage wird mit realen (600307) Daten vorinstalliert, sodass Sie Prognosen und Annahmen anpassen können & Steel Co., Ltd.
Discounted Cash Flow (DCF) - (USD MM)
| Year | AY1 2020 |
AY2 2021 |
AY3 2022 |
AY4 2023 |
AY5 2024 |
FY1 2025 |
FY2 2026 |
FY3 2027 |
FY4 2028 |
FY5 2029 |
|---|---|---|---|---|---|---|---|---|---|---|
| Revenue | 37,021.0 | 48,668.4 | 44,610.6 | 39,452.2 | 34,841.7 | 34,830.8 | 34,819.8 | 34,808.9 | 34,798.0 | 34,787.1 |
| Revenue Growth, % | 0 | 31.46 | -8.34 | -11.56 | -11.69 | -0.03139696 | -0.03139696 | -0.03139696 | -0.03139696 | -0.03139696 |
| EBITDA | 2,547.6 | 3,747.7 | -854.5 | 274.7 | -811.8 | 768.6 | 768.3 | 768.1 | 767.8 | 767.6 |
| EBITDA, % | 6.88 | 7.7 | -1.92 | 0.69639 | -2.33 | 2.21 | 2.21 | 2.21 | 2.21 | 2.21 |
| Depreciation | 1,343.8 | 1,406.9 | 1,418.7 | 1,314.3 | 1,189.6 | 1,145.7 | 1,145.3 | 1,145.0 | 1,144.6 | 1,144.3 |
| Depreciation, % | 3.63 | 2.89 | 3.18 | 3.33 | 3.41 | 3.29 | 3.29 | 3.29 | 3.29 | 3.29 |
| EBIT | 1,203.8 | 2,340.8 | -2,273.2 | -1,039.5 | -2,001.4 | -377.1 | -377.0 | -376.9 | -376.8 | -376.6 |
| EBIT, % | 3.25 | 4.81 | -5.1 | -2.63 | -5.74 | -1.08 | -1.08 | -1.08 | -1.08 | -1.08 |
| Total Cash | 4,391.5 | 4,765.1 | 4,482.5 | 4,300.5 | 3,039.8 | 3,575.5 | 3,574.3 | 3,573.2 | 3,572.1 | 3,571.0 |
| Total Cash, percent | .0 | .0 | .0 | .0 | .0 | .0 | .0 | .0 | .0 | .0 |
| Account Receivables | 2,476.8 | 542.4 | 470.3 | 674.2 | 564.2 | 849.0 | 848.7 | 848.5 | 848.2 | 847.9 |
| Account Receivables, % | 6.69 | 1.11 | 1.05 | 1.71 | 1.62 | 2.44 | 2.44 | 2.44 | 2.44 | 2.44 |
| Inventories | 6,574.6 | 8,142.9 | 5,386.8 | 5,605.0 | 4,829.9 | 5,199.2 | 5,197.6 | 5,195.9 | 5,194.3 | 5,192.7 |
| Inventories, % | 17.76 | 16.73 | 12.08 | 14.21 | 13.86 | 14.93 | 14.93 | 14.93 | 14.93 | 14.93 |
| Accounts Payable | 10,391.5 | 11,321.3 | 11,275.1 | 13,983.1 | 15,303.3 | 10,865.2 | 10,861.8 | 10,858.4 | 10,855.0 | 10,851.6 |
| Accounts Payable, % | 28.07 | 23.26 | 25.27 | 35.44 | 43.92 | 31.19 | 31.19 | 31.19 | 31.19 | 31.19 |
| Capital Expenditure | -892.6 | -705.4 | -2,184.3 | -3,290.9 | -5,376.2 | -2,266.0 | -2,265.3 | -2,264.6 | -2,263.9 | -2,263.2 |
| Capital Expenditure, % | -2.41 | -1.45 | -4.9 | -8.34 | -15.43 | -6.51 | -6.51 | -6.51 | -6.51 | -6.51 |
| Tax Rate, % | -1.18 | -1.18 | -1.18 | -1.18 | -1.18 | -1.18 | -1.18 | -1.18 | -1.18 | -1.18 |
| EBITAT | 1,215.9 | 2,038.7 | -2,013.7 | -1,033.8 | -2,025.1 | -358.4 | -358.3 | -358.1 | -358.0 | -357.9 |
| Depreciation | ||||||||||
| Changes in Account Receivables | ||||||||||
| Changes in Inventories | ||||||||||
| Changes in Accounts Payable | ||||||||||
| Capital Expenditure | ||||||||||
| UFCF | 3,007.2 | 4,036.1 | 2.7 | -724.6 | -4,006.5 | -6,570.8 | -1,479.7 | -1,479.3 | -1,478.8 | -1,478.3 |
| WACC, % | 4.6 | 4.28 | 4.32 | 4.58 | 4.6 | 4.48 | 4.48 | 4.48 | 4.48 | 4.48 |
| PV UFCF | ||||||||||
| SUM PV UFCF | -11,370.9 | |||||||||
| Long Term Growth Rate, % | 2.00 | |||||||||
| Free cash flow (T + 1) | -1,508 | |||||||||
| Terminal Value | -60,888 | |||||||||
| Present Terminal Value | -48,914 | |||||||||
| Enterprise Value | -60,285 | |||||||||
| Net Debt | 16,237 | |||||||||
| Equity Value | -76,522 | |||||||||
| Diluted Shares Outstanding, MM | 6,263 | |||||||||
| Equity Value Per Share | -12.22 |
Benefits You'll Receive
- Customizable Excel Template: A fully adjustable Excel-based DCF Calculator featuring pre-loaded financial data for Gansu Jiu Steel Group Hongxing Iron & Steel Co.,Ltd. (600307SS).
- Authentic Data: Access to historical performance data and forward-looking projections (highlighted in the yellow cells).
- Flexible Forecasting: Easily modify assumptions regarding revenue growth, EBITDA %, and WACC.
- Instant Calculations: Quickly observe how your inputs affect the valuation of Gansu Jiu Steel Group Hongxing Iron & Steel Co.,Ltd. (600307SS).
- Professional-Grade Tool: Designed for investors, CFOs, consultants, and financial analysts.
- Intuitive Layout: Organized for simplicity and ease of navigation, complete with detailed, step-by-step guidance.
Key Features
- Pre-Loaded Data: Historical financial statements and forecasts for Gansu Jiu Steel Group Hongxing Iron & Steel Co.,Ltd. (600307SS).
- Fully Adjustable Inputs: Customize parameters such as WACC, tax rates, revenue growth, and EBITDA margins.
- Instant Results: View the intrinsic value of Gansu Jiu Steel Group Hongxing Iron & Steel Co.,Ltd. (600307SS) recalculating in real time.
- Clear Visual Outputs: Dashboard charts illustrate valuation results and essential metrics.
- Built for Accuracy: A professional-grade tool designed for analysts, investors, and finance professionals.
How It Works
- Download the Template: Gain immediate access to the Excel-based Gansu Jiu Steel DCF Calculator for (600307SS).
- Input Your Assumptions: Modify the yellow-highlighted cells to reflect your estimates for growth rates, WACC, profit margins, and other variables.
- Instant Calculations: The model automatically recalculates the intrinsic value of Gansu Jiu Steel.
- Test Scenarios: Explore various assumptions to assess changes in valuation outcomes.
- Analyze and Decide: Utilize the findings to inform your investment or financial strategy.
Why Opt for This Calculator?
- All-in-One Solution: Integrates DCF, WACC, and financial ratio analyses seamlessly.
- Flexible Inputs: Modify the yellow-highlighted fields to explore different scenarios.
- In-Depth Analysis: Automatically computes Gansu Jiu Steel Group Hongxing Iron & Steel Co.,Ltd.’s intrinsic value and Net Present Value.
- Preloaded Information: Historical and projected data provide reliable starting points.
- Industry-Grade Result: Perfect for financial analysts, investors, and business consultants alike.
Who Should Use This Product?
- Investors: Gain a precise estimation of Gansu Jiu Steel Group Hongxing Iron & Steel Co., Ltd.'s fair value (600307SS) to inform investment choices.
- CFOs: Utilize a high-quality DCF model for comprehensive financial reporting and analysis for Gansu Jiu Steel Group Hongxing Iron & Steel Co., Ltd. (600307SS).
- Consultants: Effortlessly customize the template for valuation reports tailored to clients in the steel industry.
- Entrepreneurs: Acquire valuable insights into financial modeling practices employed by leading companies in the steel sector.
- Educators: Employ this resource as a teaching aid to illustrate various valuation methodologies relevant to Gansu Jiu Steel Group Hongxing Iron & Steel Co., Ltd. (600307SS).
Contents of the Template
- Operating and Balance Sheet Data: Pre-filled historical data and forecasts for Gansu Jiu Steel Group Hongxing Iron & Steel Co., Ltd. (600307SS), including revenue, EBITDA, EBIT, and capital expenditures.
- WACC Calculation: A dedicated sheet for the Weighted Average Cost of Capital (WACC) with essential parameters such as Beta, risk-free rate, and share price.
- DCF Valuation (Unlevered and Levered): Customizable Discounted Cash Flow models presenting intrinsic value along with comprehensive calculations.
- Financial Statements: Pre-loaded annual and quarterly financial statements to facilitate thorough analysis.
- Key Ratios: Includes profitability, leverage, and efficiency ratios specific to Gansu Jiu Steel Group Hongxing Iron & Steel Co., Ltd. (600307SS).
- Dashboard and Charts: Visual overview of valuation outputs and assumptions to simplify the analysis of results.
Disclaimer
All information, articles, and product details provided on this website are for general informational and educational purposes only. We do not claim any ownership over, nor do we intend to infringe upon, any trademarks, copyrights, logos, brand names, or other intellectual property mentioned or depicted on this site. Such intellectual property remains the property of its respective owners, and any references here are made solely for identification or informational purposes, without implying any affiliation, endorsement, or partnership.
We make no representations or warranties, express or implied, regarding the accuracy, completeness, or suitability of any content or products presented. Nothing on this website should be construed as legal, tax, investment, financial, medical, or other professional advice. In addition, no part of this site—including articles or product references—constitutes a solicitation, recommendation, endorsement, advertisement, or offer to buy or sell any securities, franchises, or other financial instruments, particularly in jurisdictions where such activity would be unlawful.
All content is of a general nature and may not address the specific circumstances of any individual or entity. It is not a substitute for professional advice or services. Any actions you take based on the information provided here are strictly at your own risk. You accept full responsibility for any decisions or outcomes arising from your use of this website and agree to release us from any liability in connection with your use of, or reliance upon, the content or products found herein.