
|
China Petroleum Engineering Corporation (600339.SS) DCF -Bewertung |
Fully Editable: Tailor To Your Needs In Excel Or Sheets
Professional Design: Trusted, Industry-Standard Templates
Investor-Approved Valuation Models
MAC/PC Compatible, Fully Unlocked
No Expertise Is Needed; Easy To Follow
China Petroleum Engineering Corporation (600339.SS) Bundle
Optimieren Sie Ihre Analyse und verbessern Sie die Präzision mit unserem DCF -Taschenrechner (600339S)! Mit tatsächlichen Daten der China Petroleum Engineering Corporation und anpassbaren Annahmen ermöglichen dieses Tool Sie, wie ein erfahrener Investor zu prognostizieren, zu bewerten und zu bewerten (600339S).
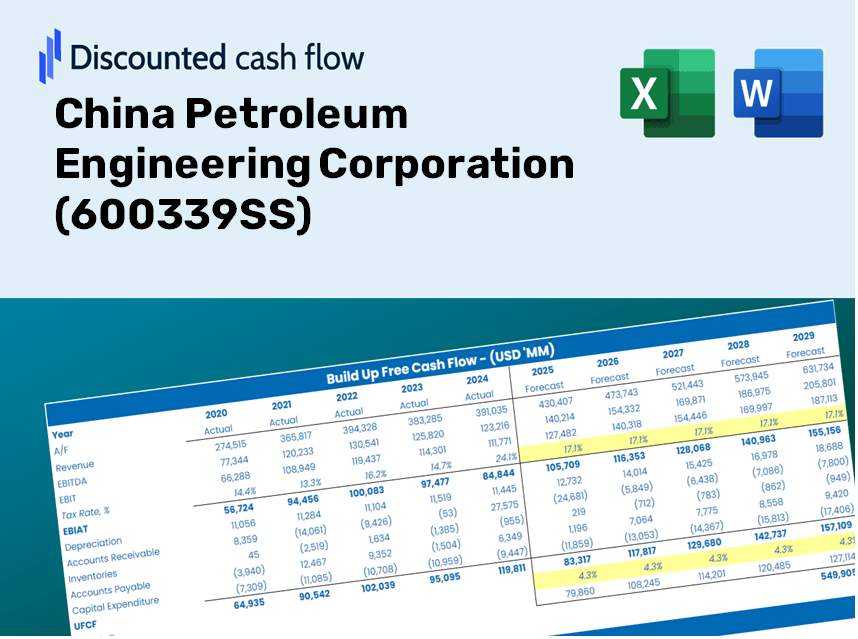
Discounted Cash Flow (DCF) - (USD MM)
| Year | AY1 2020 |
AY2 2021 |
AY3 2022 |
AY4 2023 |
AY5 2024 |
FY1 2025 |
FY2 2026 |
FY3 2027 |
FY4 2028 |
FY5 2029 |
|---|---|---|---|---|---|---|---|---|---|---|
| Revenue | 70,698.5 | 79,831.8 | 83,589.6 | 80,343.4 | 85,917.3 | 90,359.3 | 95,030.9 | 99,944.0 | 105,111.1 | 110,545.3 |
| Revenue Growth, % | 0 | 12.92 | 4.71 | -3.88 | 6.94 | 5.17 | 5.17 | 5.17 | 5.17 | 5.17 |
| EBITDA | 2,448.2 | 2,028.1 | 2,402.9 | 2,706.0 | 2,542.9 | 2,747.9 | 2,890.0 | 3,039.4 | 3,196.6 | 3,361.8 |
| EBITDA, % | 3.46 | 2.54 | 2.87 | 3.37 | 2.96 | 3.04 | 3.04 | 3.04 | 3.04 | 3.04 |
| Depreciation | 925.3 | 1,129.9 | 1,170.1 | 1,109.6 | 982.4 | 1,201.5 | 1,263.6 | 1,328.9 | 1,397.6 | 1,469.9 |
| Depreciation, % | 1.31 | 1.42 | 1.4 | 1.38 | 1.14 | 1.33 | 1.33 | 1.33 | 1.33 | 1.33 |
| EBIT | 1,522.9 | 898.2 | 1,232.8 | 1,596.4 | 1,560.5 | 1,546.5 | 1,626.4 | 1,710.5 | 1,798.9 | 1,892.0 |
| EBIT, % | 2.15 | 1.13 | 1.47 | 1.99 | 1.82 | 1.71 | 1.71 | 1.71 | 1.71 | 1.71 |
| Total Cash | 29,836.1 | 21,016.1 | 29,610.7 | 34,143.2 | 31,397.6 | 33,070.0 | 34,779.7 | 36,577.8 | 38,468.9 | 40,457.8 |
| Total Cash, percent | .0 | .0 | .0 | .0 | .0 | .0 | .0 | .0 | .0 | .0 |
| Account Receivables | 43,573.7 | 52,078.7 | 46,717.0 | 38,970.2 | 46,209.8 | 51,513.1 | 54,176.3 | 56,977.2 | 59,922.9 | 63,021.0 |
| Account Receivables, % | 61.63 | 65.24 | 55.89 | 48.5 | 53.78 | 57.01 | 57.01 | 57.01 | 57.01 | 57.01 |
| Inventories | 8,635.0 | 9,168.2 | 14,323.7 | 12,866.5 | 14,120.9 | 13,243.7 | 13,928.5 | 14,648.6 | 15,405.9 | 16,202.4 |
| Inventories, % | 12.21 | 11.48 | 17.14 | 16.01 | 16.44 | 14.66 | 14.66 | 14.66 | 14.66 | 14.66 |
| Accounts Payable | 34,956.5 | 41,752.9 | 37,372.5 | 34,834.1 | 18,558.6 | 38,206.1 | 40,181.4 | 42,258.7 | 44,443.5 | 46,741.2 |
| Accounts Payable, % | 49.44 | 52.3 | 44.71 | 43.36 | 21.6 | 42.28 | 42.28 | 42.28 | 42.28 | 42.28 |
| Capital Expenditure | -492.2 | -516.4 | -336.1 | -321.6 | -418.1 | -475.6 | -500.2 | -526.1 | -553.3 | -581.9 |
| Capital Expenditure, % | -0.69616 | -0.64683 | -0.40203 | -0.40033 | -0.48662 | -0.5264 | -0.5264 | -0.5264 | -0.5264 | -0.5264 |
| Tax Rate, % | 53.98 | 53.98 | 53.98 | 53.98 | 53.98 | 53.98 | 53.98 | 53.98 | 53.98 | 53.98 |
| EBITAT | 859.3 | 457.1 | 702.4 | 836.4 | 718.1 | 812.6 | 854.6 | 898.7 | 945.2 | 994.1 |
| Depreciation | ||||||||||
| Changes in Account Receivables | ||||||||||
| Changes in Inventories | ||||||||||
| Changes in Accounts Payable | ||||||||||
| Capital Expenditure | ||||||||||
| UFCF | -15,959.8 | -1,171.2 | -2,637.7 | 8,289.8 | -23,487.0 | 16,759.7 | 245.2 | 257.9 | 271.2 | 285.3 |
| WACC, % | 4.54 | 4.47 | 4.55 | 4.49 | 4.41 | 4.49 | 4.49 | 4.49 | 4.49 | 4.49 |
| PV UFCF | ||||||||||
| SUM PV UFCF | 16,946.2 | |||||||||
| Long Term Growth Rate, % | 3.00 | |||||||||
| Free cash flow (T + 1) | 294 | |||||||||
| Terminal Value | 19,675 | |||||||||
| Present Terminal Value | 15,793 | |||||||||
| Enterprise Value | 32,739 | |||||||||
| Net Debt | -21,380 | |||||||||
| Equity Value | 54,119 | |||||||||
| Diluted Shares Outstanding, MM | 5,583 | |||||||||
| Equity Value Per Share | 9.69 |
What You'll Receive
- Authentic Data for China Petroleum Engineering: Preloaded financial metrics – ranging from revenue to EBIT – based on real and projected data.
- Comprehensive Customization: Modify all key parameters (yellow cells) such as WACC, growth %, and tax rates to fit your needs.
- Immediate Valuation Adjustments: Automatic recalculations to assess the impact of changes on the fair value of China Petroleum Engineering Corporation (600339SS).
- Flexible Excel Template: Designed for rapid adjustments, scenario analysis, and in-depth projections.
- Efficient and Reliable: Eliminate the need to build models from the ground up while ensuring accuracy and adaptability.
Key Features
- Comprehensive Historical Data: Access to China Petroleum Engineering Corporation’s (600339SS) past financial statements and projections.
- Customizable Parameters: Modify WACC, tax rates, revenue growth, and EBITDA margins to suit your analysis.
- Real-Time Calculations: Instantly observe the intrinsic value of China Petroleum Engineering Corporation (600339SS) updated as you make changes.
- Intuitive Visualizations: Dynamic dashboard graphs illustrate valuation outcomes and critical metrics clearly.
- Designed for Precision: A robust tool tailored for analysts, investors, and finance professionals.
How It Functions
- 1. Download the Template: Retrieve and open the Excel file containing the data for China Petroleum Engineering Corporation (600339SS).
- 2. Adjust Assumptions: Modify essential inputs such as growth estimates, WACC, and capital expenditures.
- 3. Obtain Instant Results: The DCF model automatically computes the intrinsic value and NPV.
- 4. Explore Different Scenarios: Evaluate various forecasts to understand a range of valuation possibilities.
- 5. Present with Assurance: Share professional valuation analyses to bolster your strategic decisions.
Why Opt for This Calculator?
- Time-Saving: Eliminate the hassle of building a DCF model from the ground up – it’s immediately accessible.
- Enhanced Precision: Reliable financial data and formulas help minimize valuation errors.
- Completely Customizable: Adjust the model to suit your specific assumptions and forecasts.
- User-Friendly: Intuitive charts and outputs make the results straightforward to analyze.
- Endorsed by Professionals: Created for experts who prioritize accuracy and ease of use.
Who Can Benefit from This Product?
- Investors: Enhance your investment strategies with a top-tier valuation tool tailored for precision.
- Financial Analysts: Streamline your workflow with an easy-to-customize DCF model designed for efficiency.
- Consultants: Effortlessly modify the template for impactful client presentations or detailed reports.
- Finance Enthusiasts: Expand your knowledge of valuation methodologies through practical, real-world scenarios.
- Educators and Students: Utilize this resource as an effective learning aid in finance-related disciplines.
Contents of the Template
- Pre-Filled Data: Contains historical financial data and forecasts for China Petroleum Engineering Corporation (600339SS).
- Discounted Cash Flow Model: An editable DCF valuation model featuring automated calculations.
- Weighted Average Cost of Capital (WACC): A dedicated worksheet for computing WACC using tailored inputs.
- Key Financial Ratios: Evaluate the profitability, efficiency, and leverage of China Petroleum Engineering Corporation (600339SS).
- Customizable Inputs: Easily modify revenue growth, profit margins, and tax rates.
- Clear Dashboard: Graphs and tables that summarize critical valuation outcomes.
Disclaimer
All information, articles, and product details provided on this website are for general informational and educational purposes only. We do not claim any ownership over, nor do we intend to infringe upon, any trademarks, copyrights, logos, brand names, or other intellectual property mentioned or depicted on this site. Such intellectual property remains the property of its respective owners, and any references here are made solely for identification or informational purposes, without implying any affiliation, endorsement, or partnership.
We make no representations or warranties, express or implied, regarding the accuracy, completeness, or suitability of any content or products presented. Nothing on this website should be construed as legal, tax, investment, financial, medical, or other professional advice. In addition, no part of this site—including articles or product references—constitutes a solicitation, recommendation, endorsement, advertisement, or offer to buy or sell any securities, franchises, or other financial instruments, particularly in jurisdictions where such activity would be unlawful.
All content is of a general nature and may not address the specific circumstances of any individual or entity. It is not a substitute for professional advice or services. Any actions you take based on the information provided here are strictly at your own risk. You accept full responsibility for any decisions or outcomes arising from your use of this website and agree to release us from any liability in connection with your use of, or reliance upon, the content or products found herein.