
|
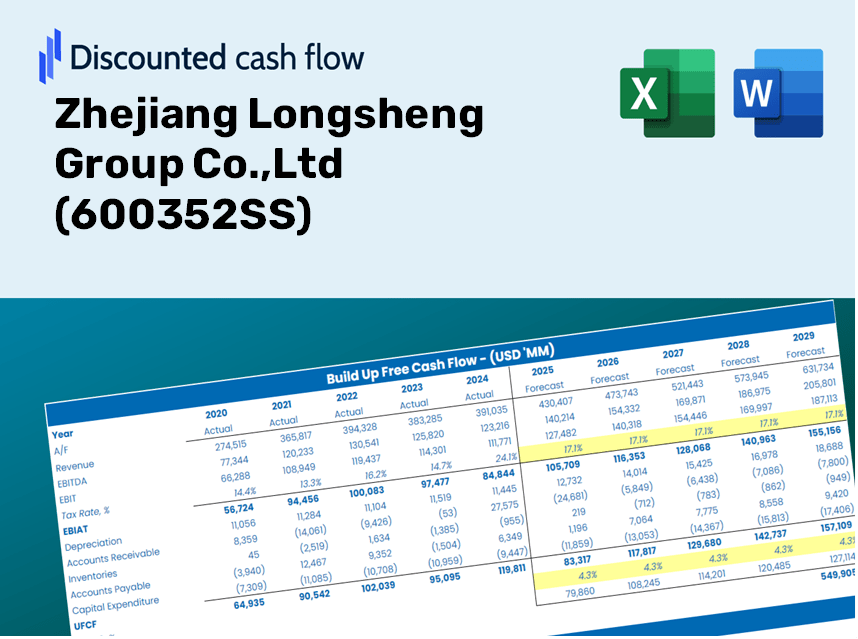
Zhejiang Longsheng Group Co., Ltd (600352.SS) DCF -Bewertung |
Fully Editable: Tailor To Your Needs In Excel Or Sheets
Professional Design: Trusted, Industry-Standard Templates
Investor-Approved Valuation Models
MAC/PC Compatible, Fully Unlocked
No Expertise Is Needed; Easy To Follow
Zhejiang Longsheng Group Co.,Ltd (600352.SS) Bundle
Optimieren Sie Ihre Analyse und verbessern Sie die Präzision mit unserem DCF -Taschenrechner (600352S)! Mit echten Daten von Zhejiang Longsheng Group Co., Ltd und anpassbaren Annahmen ermöglichen dieses Tool Sie, wie ein erfahrener Investor prognostizieren, analysieren und value (600352Ss).
Discounted Cash Flow (DCF) - (USD MM)
| Year | AY1 2020 |
AY2 2021 |
AY3 2022 |
AY4 2023 |
AY5 2024 |
FY1 2025 |
FY2 2026 |
FY3 2027 |
FY4 2028 |
FY5 2029 |
|---|---|---|---|---|---|---|---|---|---|---|
| Revenue | 15,605.4 | 16,659.8 | 21,225.6 | 15,303.1 | 15,883.9 | 15,983.0 | 16,082.7 | 16,183.0 | 16,284.0 | 16,385.6 |
| Revenue Growth, % | 0 | 6.76 | 27.41 | -27.9 | 3.79 | 0.62397 | 0.62397 | 0.62397 | 0.62397 | 0.62397 |
| EBITDA | 6,201.4 | 5,549.1 | 5,169.7 | 3,136.1 | 4,121.2 | 4,598.1 | 4,626.7 | 4,655.6 | 4,684.7 | 4,713.9 |
| EBITDA, % | 39.74 | 33.31 | 24.36 | 20.49 | 25.95 | 28.77 | 28.77 | 28.77 | 28.77 | 28.77 |
| Depreciation | 801.2 | 948.6 | 976.5 | 933.5 | 905.9 | 870.5 | 875.9 | 881.4 | 886.9 | 892.4 |
| Depreciation, % | 5.13 | 5.69 | 4.6 | 6.1 | 5.7 | 5.45 | 5.45 | 5.45 | 5.45 | 5.45 |
| EBIT | 5,400.1 | 4,600.5 | 4,193.3 | 2,202.6 | 3,215.4 | 3,727.6 | 3,750.8 | 3,774.2 | 3,797.8 | 3,821.5 |
| EBIT, % | 34.6 | 27.61 | 19.76 | 14.39 | 20.24 | 23.32 | 23.32 | 23.32 | 23.32 | 23.32 |
| Total Cash | 6,676.9 | 8,172.6 | 8,256.4 | 12,346.9 | 18,545.7 | 9,954.9 | 10,017.0 | 10,079.5 | 10,142.4 | 10,205.7 |
| Total Cash, percent | .0 | .0 | .0 | .0 | .0 | .0 | .0 | .0 | .0 | .0 |
| Account Receivables | 5,269.5 | 5,132.1 | 4,994.6 | 4,158.7 | 3,852.1 | 4,460.2 | 4,488.1 | 4,516.1 | 4,544.2 | 4,572.6 |
| Account Receivables, % | 33.77 | 30.81 | 23.53 | 27.18 | 24.25 | 27.91 | 27.91 | 27.91 | 27.91 | 27.91 |
| Inventories | 23,846.6 | 28,239.4 | 28,648.5 | 29,321.5 | 28,832.5 | 15,983.0 | 16,082.7 | 16,183.0 | 16,284.0 | 16,385.6 |
| Inventories, % | 152.81 | 169.51 | 134.97 | 191.6 | 181.52 | 100 | 100 | 100 | 100 | 100 |
| Accounts Payable | 3,789.0 | 4,547.6 | 4,470.5 | 589.9 | 3,494.2 | 3,148.4 | 3,168.0 | 3,187.8 | 3,207.7 | 3,227.7 |
| Accounts Payable, % | 24.28 | 27.3 | 21.06 | 3.85 | 22 | 19.7 | 19.7 | 19.7 | 19.7 | 19.7 |
| Capital Expenditure | -567.5 | -625.0 | -588.1 | -227.8 | -135.9 | -399.7 | -402.1 | -404.7 | -407.2 | -409.7 |
| Capital Expenditure, % | -3.64 | -3.75 | -2.77 | -1.49 | -0.85573 | -2.5 | -2.5 | -2.5 | -2.5 | -2.5 |
| Tax Rate, % | 27.79 | 27.79 | 27.79 | 27.79 | 27.79 | 27.79 | 27.79 | 27.79 | 27.79 | 27.79 |
| EBITAT | 4,286.1 | 3,610.5 | 3,150.0 | 1,733.2 | 2,321.7 | 2,861.8 | 2,879.6 | 2,897.6 | 2,915.7 | 2,933.9 |
| Depreciation | ||||||||||
| Changes in Account Receivables | ||||||||||
| Changes in Inventories | ||||||||||
| Changes in Accounts Payable | ||||||||||
| Capital Expenditure | ||||||||||
| UFCF | -20,807.2 | 437.4 | 3,189.5 | -1,278.7 | 6,791.6 | 15,228.2 | 3,245.5 | 3,265.8 | 3,286.1 | 3,306.6 |
| WACC, % | 5.66 | 5.65 | 5.62 | 5.65 | 5.59 | 5.64 | 5.64 | 5.64 | 5.64 | 5.64 |
| PV UFCF | ||||||||||
| SUM PV UFCF | 25,247.1 | |||||||||
| Long Term Growth Rate, % | 3.00 | |||||||||
| Free cash flow (T + 1) | 3,406 | |||||||||
| Terminal Value | 129,179 | |||||||||
| Present Terminal Value | 98,203 | |||||||||
| Enterprise Value | 123,450 | |||||||||
| Net Debt | -6,671 | |||||||||
| Equity Value | 130,121 | |||||||||
| Diluted Shares Outstanding, MM | 3,223 | |||||||||
| Equity Value Per Share | 40.38 |
What You Will Receive
- Authentic 600352SS Financials: Comprehensive historical and projected data for precise valuation.
- Customizable Inputs: Alter WACC, tax rates, revenue growth, and capital expenditures to suit your analysis.
- Real-Time Calculations: Intrinsic value and NPV are computed automatically as you input data.
- Scenario Simulation: Evaluate various scenarios to assess Zhejiang Longsheng Group Co., Ltd's future performance.
- User-Friendly Design: Optimized for professionals while remaining approachable for beginners.
Key Features
- 🔍 Real-Life 600352SS Financials: Pre-filled historical and projected data for Zhejiang Longsheng Group Co., Ltd.
- ✏️ Fully Customizable Inputs: Modify all essential parameters (yellow cells) such as WACC, growth %, and tax rates.
- 📊 Professional DCF Valuation: Integrated formulas determine the intrinsic value of Zhejiang Longsheng Group utilizing the Discounted Cash Flow method.
- ⚡ Instant Results: Visualize the company's valuation in real-time after adjustments.
- Scenario Analysis: Evaluate and contrast outcomes for different financial assumptions side-by-side.
How It Works
- Download the Template: Gain immediate access to the Excel-based ZHEJIANG LONGSHENG DCF Calculator.
- Input Your Assumptions: Modify the yellow-highlighted cells to set your growth rates, WACC, margins, and other variables.
- Instant Calculations: The model will automatically compute the intrinsic value of Zhejiang Longsheng Group Co., Ltd (600352SS).
- Test Scenarios: Experiment with various assumptions to assess how they impact valuation outcomes.
- Analyze and Decide: Utilize the findings to inform your investment strategy or financial assessments.
Why Choose This Calculator for Zhejiang Longsheng Group Co., Ltd (600352SS)?
- Designed for Experts: A sophisticated tool utilized by financial analysts, CFOs, and industry consultants.
- Accurate Financial Data: Historical and projected financial information for Zhejiang Longsheng Group preloaded for reliable insights.
- Forecast Simulation: Effortlessly test various scenarios and assumptions.
- Insightful Results: Automatically computes intrinsic value, NPV, and essential financial metrics.
- User-Friendly: Comprehensive step-by-step instructions to assist you throughout the process.
Who Can Benefit from This Product?
- Finance Students: Master valuation methodologies and practice with authentic data.
- Academics: Integrate industry-standard models into your teaching materials or research projects.
- Investors: Evaluate your hypotheses and scrutinize valuation scenarios for Zhejiang Longsheng Group Co.,Ltd (600352SS).
- Analysts: Enhance your efficiency with a ready-to-use, adjustable DCF model.
- Small Business Owners: Discover how major publicly traded companies, like Zhejiang Longsheng Group Co.,Ltd (600352SS), are valued and analyzed.
Contents of the Template
- Preloaded 600352SS Data: Historical and projected financial information, including revenue, EBIT, and capital expenditures.
- DCF and WACC Models: High-quality spreadsheets for determining intrinsic value and the Weighted Average Cost of Capital.
- Editable Inputs: Yellow-highlighted cells for modifying revenue growth, tax rates, and discount rates.
- Financial Statements: Detailed annual and quarterly financial data for thorough analysis.
- Key Ratios: Ratios for profitability, leverage, and efficiency to assess performance.
- Dashboard and Charts: Visual representations of valuation results and underlying assumptions.
Disclaimer
All information, articles, and product details provided on this website are for general informational and educational purposes only. We do not claim any ownership over, nor do we intend to infringe upon, any trademarks, copyrights, logos, brand names, or other intellectual property mentioned or depicted on this site. Such intellectual property remains the property of its respective owners, and any references here are made solely for identification or informational purposes, without implying any affiliation, endorsement, or partnership.
We make no representations or warranties, express or implied, regarding the accuracy, completeness, or suitability of any content or products presented. Nothing on this website should be construed as legal, tax, investment, financial, medical, or other professional advice. In addition, no part of this site—including articles or product references—constitutes a solicitation, recommendation, endorsement, advertisement, or offer to buy or sell any securities, franchises, or other financial instruments, particularly in jurisdictions where such activity would be unlawful.
All content is of a general nature and may not address the specific circumstances of any individual or entity. It is not a substitute for professional advice or services. Any actions you take based on the information provided here are strictly at your own risk. You accept full responsibility for any decisions or outcomes arising from your use of this website and agree to release us from any liability in connection with your use of, or reliance upon, the content or products found herein.