
|
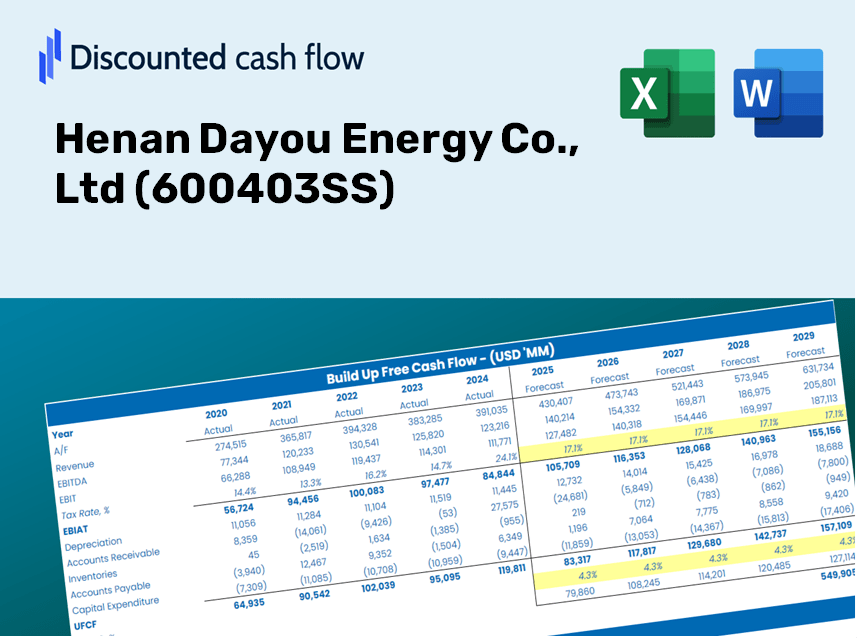
Henan Dayou Energy Co., Ltd (600403.SS) DCF -Bewertung |
Fully Editable: Tailor To Your Needs In Excel Or Sheets
Professional Design: Trusted, Industry-Standard Templates
Investor-Approved Valuation Models
MAC/PC Compatible, Fully Unlocked
No Expertise Is Needed; Easy To Follow
Henan Dayou Energy Co., Ltd (600403.SS) Bundle
Vereinfachen Sie die Bewertung von Henan Dayou Energy Co., Ltd mit diesem anpassbaren DCF -Taschenrechner! Mit Real Henan Dayou Energy Co., Ltd Financials und einstellbaren prognostizierten Inputs können Sie Szenarien testen und Henan Dayou Energy Co., Ltd Fair Value in Minuten aufdecken.
Discounted Cash Flow (DCF) - (USD MM)
| Year | AY1 2020 |
AY2 2021 |
AY3 2022 |
AY4 2023 |
AY5 2024 |
FY1 2025 |
FY2 2026 |
FY3 2027 |
FY4 2028 |
FY5 2029 |
|---|---|---|---|---|---|---|---|---|---|---|
| Revenue | 6,826.2 | 7,910.5 | 8,588.6 | 5,814.3 | 4,930.4 | 4,614.0 | 4,318.0 | 4,041.0 | 3,781.7 | 3,539.1 |
| Revenue Growth, % | 0 | 15.88 | 8.57 | -32.3 | -15.2 | -6.42 | -6.42 | -6.42 | -6.42 | -6.42 |
| EBITDA | 737.8 | 2,571.4 | 3,627.7 | 812.8 | 388.5 | 991.2 | 927.6 | 868.1 | 812.4 | 760.3 |
| EBITDA, % | 10.81 | 32.51 | 42.24 | 13.98 | 7.88 | 21.48 | 21.48 | 21.48 | 21.48 | 21.48 |
| Depreciation | 912.1 | 969.3 | 1,096.1 | 1,036.8 | 1,087.5 | 722.2 | 675.9 | 632.5 | 592.0 | 554.0 |
| Depreciation, % | 13.36 | 12.25 | 12.76 | 17.83 | 22.06 | 15.65 | 15.65 | 15.65 | 15.65 | 15.65 |
| EBIT | -174.3 | 1,602.1 | 2,531.7 | -224.0 | -699.0 | 269.0 | 251.7 | 235.6 | 220.4 | 206.3 |
| EBIT, % | -2.55 | 20.25 | 29.48 | -3.85 | -14.18 | 5.83 | 5.83 | 5.83 | 5.83 | 5.83 |
| Total Cash | 4,250.4 | 5,016.2 | 5,511.7 | 4,306.5 | 4,304.1 | 3,241.1 | 3,033.1 | 2,838.5 | 2,656.4 | 2,486.0 |
| Total Cash, percent | .0 | .0 | .0 | .0 | .0 | .0 | .0 | .0 | .0 | .0 |
| Account Receivables | 1,003.5 | 1,128.3 | 1,178.1 | 889.9 | 816.6 | 687.9 | 643.8 | 602.5 | 563.8 | 527.7 |
| Account Receivables, % | 14.7 | 14.26 | 13.72 | 15.31 | 16.56 | 14.91 | 14.91 | 14.91 | 14.91 | 14.91 |
| Inventories | 175.3 | 173.7 | 199.7 | 180.7 | 185.5 | 128.8 | 120.5 | 112.8 | 105.6 | 98.8 |
| Inventories, % | 2.57 | 2.2 | 2.33 | 3.11 | 3.76 | 2.79 | 2.79 | 2.79 | 2.79 | 2.79 |
| Accounts Payable | 2,806.4 | 2,647.9 | 3,475.6 | 3,559.8 | 3,603.4 | 2,301.1 | 2,153.5 | 2,015.3 | 1,886.0 | 1,765.0 |
| Accounts Payable, % | 41.11 | 33.47 | 40.47 | 61.23 | 73.09 | 49.87 | 49.87 | 49.87 | 49.87 | 49.87 |
| Capital Expenditure | -443.4 | -795.5 | -891.2 | -817.8 | -826.7 | -533.0 | -498.8 | -466.8 | -436.9 | -408.8 |
| Capital Expenditure, % | -6.5 | -10.06 | -10.38 | -14.07 | -16.77 | -11.55 | -11.55 | -11.55 | -11.55 | -11.55 |
| Tax Rate, % | -24.31 | -24.31 | -24.31 | -24.31 | -24.31 | -24.31 | -24.31 | -24.31 | -24.31 | -24.31 |
| EBITAT | -215.6 | 1,538.7 | 1,837.2 | -399.1 | -868.9 | 252.1 | 235.9 | 220.8 | 206.6 | 193.3 |
| Depreciation | ||||||||||
| Changes in Account Receivables | ||||||||||
| Changes in Inventories | ||||||||||
| Changes in Accounts Payable | ||||||||||
| Capital Expenditure | ||||||||||
| UFCF | 1,880.7 | 1,430.8 | 2,794.0 | 211.4 | -496.1 | -675.6 | 317.8 | 297.4 | 278.3 | 260.4 |
| WACC, % | 8.14 | 8.09 | 7.83 | 8.14 | 8.14 | 8.07 | 8.07 | 8.07 | 8.07 | 8.07 |
| PV UFCF | ||||||||||
| SUM PV UFCF | 263.2 | |||||||||
| Long Term Growth Rate, % | 0.50 | |||||||||
| Free cash flow (T + 1) | 262 | |||||||||
| Terminal Value | 3,458 | |||||||||
| Present Terminal Value | 2,346 | |||||||||
| Enterprise Value | 2,609 | |||||||||
| Net Debt | 1,149 | |||||||||
| Equity Value | 1,460 | |||||||||
| Diluted Shares Outstanding, MM | 2,391 | |||||||||
| Equity Value Per Share | 0.61 |
What You Will Receive
- Pre-Loaded Financial Model: Henan Dayou Energy's actual figures facilitate accurate DCF valuation.
- Comprehensive Forecast Control: Modify revenue growth, profit margins, WACC, and other essential factors.
- Real-Time Calculations: Automatic updates ensure you view results immediately as changes are made.
- Professional-Grade Template: A polished Excel file crafted for high-quality valuation analysis.
- Adaptable and Reusable: Designed for versatility, allowing for repeated application in detailed forecasting.
Key Features
- Customizable Forecast Parameters: Adjust key inputs such as revenue growth, EBITDA %, and capital expenditures tailored to Henan Dayou Energy Co., Ltd (600403SS).
- Instant DCF Valuation: Quickly computes intrinsic value, NPV, and other financial outputs.
- High-Precision Accuracy: Leverages Henan Dayou’s actual financial data to deliver realistic valuation results.
- Seamless Scenario Analysis: Easily evaluate various assumptions and analyze their effects on outcomes.
- Efficiency Boost: Remove the hassle of constructing intricate valuation models from the ground up.
How It Operates
- Download the Template: Gain immediate access to the Excel-based DCF Calculator for Henan Dayou Energy Co., Ltd (600403SS).
- Input Your Assumptions: Modify the yellow-highlighted cells for growth rates, WACC, profit margins, and additional parameters.
- Instant Calculations: The model automatically recalculates the intrinsic value of Henan Dayou Energy Co., Ltd (600403SS).
- Test Scenarios: Experiment with various assumptions to assess how valuations may change.
- Analyze and Decide: Leverage the outcomes to inform your investment strategy or financial assessment.
Why Select This Calculator for Henan Dayou Energy (600403SS)?
- User-Friendly Interface: Suitable for both novices and seasoned analysts.
- Customizable Inputs: Effortlessly adjust parameters to suit your assessment.
- Real-Time Updates: Instantly view changes to Henan Dayou Energy’s valuation as you modify inputs.
- Easy Access: Comes pre-filled with Henan Dayou Energy’s current financial information for quick evaluations.
- Widely Used by Experts: Favored by investors and analysts for making well-informed choices.
Who Can Benefit from This Product?
- Finance Students: Master valuation methods and apply them with actual data from Henan Dayou Energy Co., Ltd (600403SS).
- Researchers: Utilize industry-standard models in your academic projects or studies.
- Investors: Validate your investment strategies and evaluate valuation results for Henan Dayou Energy Co., Ltd (600403SS).
- Financial Analysts: Enhance your analysis with a customizable, ready-to-use DCF model.
- Entrepreneurs: Understand how large publicly traded companies like Henan Dayou Energy Co., Ltd (600403SS) are assessed by the market.
Contents of the Template
- Pre-Filled Data: Contains Henan Dayou Energy Co., Ltd’s historical financial data and forecasts.
- Discounted Cash Flow Model: An editable DCF valuation model with automatic calculations included.
- Weighted Average Cost of Capital (WACC): A dedicated sheet for WACC calculations based on user-defined inputs.
- Key Financial Ratios: Evaluate Henan Dayou Energy’s profitability, efficiency, and financial leverage.
- Customizable Inputs: Easily modify parameters such as revenue growth, margins, and tax rates.
- Clear Dashboard: Visual representations through charts and tables summarizing essential valuation outcomes.
Disclaimer
All information, articles, and product details provided on this website are for general informational and educational purposes only. We do not claim any ownership over, nor do we intend to infringe upon, any trademarks, copyrights, logos, brand names, or other intellectual property mentioned or depicted on this site. Such intellectual property remains the property of its respective owners, and any references here are made solely for identification or informational purposes, without implying any affiliation, endorsement, or partnership.
We make no representations or warranties, express or implied, regarding the accuracy, completeness, or suitability of any content or products presented. Nothing on this website should be construed as legal, tax, investment, financial, medical, or other professional advice. In addition, no part of this site—including articles or product references—constitutes a solicitation, recommendation, endorsement, advertisement, or offer to buy or sell any securities, franchises, or other financial instruments, particularly in jurisdictions where such activity would be unlawful.
All content is of a general nature and may not address the specific circumstances of any individual or entity. It is not a substitute for professional advice or services. Any actions you take based on the information provided here are strictly at your own risk. You accept full responsibility for any decisions or outcomes arising from your use of this website and agree to release us from any liability in connection with your use of, or reliance upon, the content or products found herein.