
|
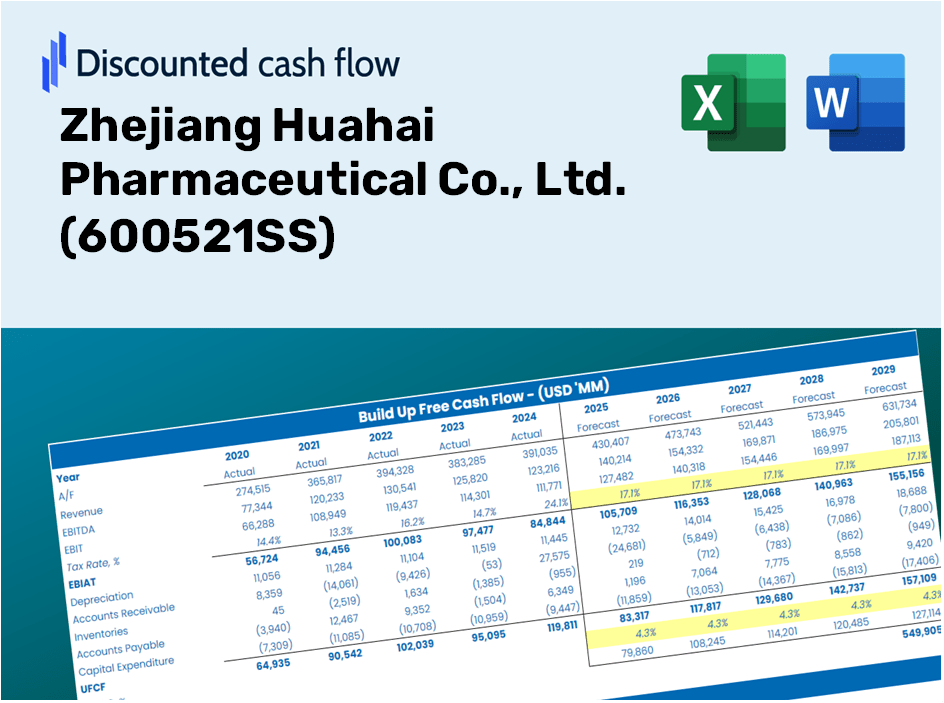
Zhejiang Huahai Pharmaceutical Co., Ltd. (600521.SS) DCF -Bewertung |
Fully Editable: Tailor To Your Needs In Excel Or Sheets
Professional Design: Trusted, Industry-Standard Templates
Investor-Approved Valuation Models
MAC/PC Compatible, Fully Unlocked
No Expertise Is Needed; Easy To Follow
Zhejiang Huahai Pharmaceutical Co., Ltd. (600521.SS) Bundle
Verbessern Sie Ihre Anlagestrategien mit dem DCF -Taschenrechner (600521S)! Überprüfen Sie die echten Finanzdaten für Zhejiang Huahai Pharmaceutical Co., Ltd., stellen Sie Wachstumsprojektionen und -kosten an und beachten Sie sofort, wie sich diese Veränderungen auf den inneren Wert des Unternehmens auswirken.
Discounted Cash Flow (DCF) - (USD MM)
| Year | AY1 2020 |
AY2 2021 |
AY3 2022 |
AY4 2023 |
AY5 2024 |
FY1 2025 |
FY2 2026 |
FY3 2027 |
FY4 2028 |
FY5 2029 |
|---|---|---|---|---|---|---|---|---|---|---|
| Revenue | 6,485.2 | 6,643.6 | 8,265.7 | 8,308.7 | 9,547.4 | 10,556.8 | 11,672.8 | 12,906.8 | 14,271.3 | 15,780.1 |
| Revenue Growth, % | 0 | 2.44 | 24.42 | 0.51992 | 14.91 | 10.57 | 10.57 | 10.57 | 10.57 | 10.57 |
| EBITDA | 1,845.8 | 1,050.3 | 2,230.5 | 2,140.6 | 2,510.3 | 2,603.5 | 2,878.8 | 3,183.1 | 3,519.6 | 3,891.7 |
| EBITDA, % | 28.46 | 15.81 | 26.98 | 25.76 | 26.29 | 24.66 | 24.66 | 24.66 | 24.66 | 24.66 |
| Depreciation | 470.8 | 547.8 | 652.6 | 780.4 | 885.7 | 888.2 | 982.1 | 1,086.0 | 1,200.8 | 1,327.7 |
| Depreciation, % | 7.26 | 8.25 | 7.89 | 9.39 | 9.28 | 8.41 | 8.41 | 8.41 | 8.41 | 8.41 |
| EBIT | 1,375.0 | 502.5 | 1,577.9 | 1,360.2 | 1,624.5 | 1,715.3 | 1,896.7 | 2,097.2 | 2,318.9 | 2,564.0 |
| EBIT, % | 21.2 | 7.56 | 19.09 | 16.37 | 17.02 | 16.25 | 16.25 | 16.25 | 16.25 | 16.25 |
| Total Cash | 2,211.9 | 1,877.3 | 1,508.2 | 1,435.5 | 1,597.4 | 2,420.0 | 2,675.8 | 2,958.7 | 3,271.5 | 3,617.4 |
| Total Cash, percent | .0 | .0 | .0 | .0 | .0 | .0 | .0 | .0 | .0 | .0 |
| Account Receivables | 1,757.1 | 1,905.7 | 2,831.5 | 2,676.6 | 3,274.2 | 3,305.2 | 3,654.6 | 4,041.0 | 4,468.2 | 4,940.5 |
| Account Receivables, % | 27.09 | 28.69 | 34.26 | 32.21 | 34.29 | 31.31 | 31.31 | 31.31 | 31.31 | 31.31 |
| Inventories | 2,368.4 | 2,738.5 | 3,374.7 | 3,432.1 | 3,413.4 | 4,130.4 | 4,567.1 | 5,049.9 | 5,583.8 | 6,174.1 |
| Inventories, % | 36.52 | 41.22 | 40.83 | 41.31 | 35.75 | 39.13 | 39.13 | 39.13 | 39.13 | 39.13 |
| Accounts Payable | 392.5 | 881.8 | 1,202.6 | 1,386.8 | 1,585.1 | 1,418.1 | 1,568.0 | 1,733.8 | 1,917.1 | 2,119.8 |
| Accounts Payable, % | 6.05 | 13.27 | 14.55 | 16.69 | 16.6 | 13.43 | 13.43 | 13.43 | 13.43 | 13.43 |
| Capital Expenditure | -1,276.5 | -2,434.5 | -2,316.3 | -1,592.4 | -1,853.3 | -2,595.4 | -2,869.8 | -3,173.2 | -3,508.7 | -3,879.6 |
| Capital Expenditure, % | -19.68 | -36.64 | -28.02 | -19.17 | -19.41 | -24.59 | -24.59 | -24.59 | -24.59 | -24.59 |
| Tax Rate, % | 23.55 | 23.55 | 23.55 | 23.55 | 23.55 | 23.55 | 23.55 | 23.55 | 23.55 | 23.55 |
| EBITAT | 1,052.0 | 311.3 | 1,221.2 | 1,026.6 | 1,242.0 | 1,261.7 | 1,395.1 | 1,542.6 | 1,705.7 | 1,886.0 |
| Depreciation | ||||||||||
| Changes in Account Receivables | ||||||||||
| Changes in Inventories | ||||||||||
| Changes in Accounts Payable | ||||||||||
| Capital Expenditure | ||||||||||
| UFCF | -3,486.8 | -1,604.7 | -1,683.6 | 496.2 | -106.2 | -1,360.4 | -1,128.7 | -1,248.1 | -1,380.0 | -1,525.9 |
| WACC, % | 8.66 | 8.56 | 8.67 | 8.66 | 8.66 | 8.64 | 8.64 | 8.64 | 8.64 | 8.64 |
| PV UFCF | ||||||||||
| SUM PV UFCF | -5,180.5 | |||||||||
| Long Term Growth Rate, % | 3.50 | |||||||||
| Free cash flow (T + 1) | -1,579 | |||||||||
| Terminal Value | -30,715 | |||||||||
| Present Terminal Value | -20,294 | |||||||||
| Enterprise Value | -25,474 | |||||||||
| Net Debt | 4,984 | |||||||||
| Equity Value | -30,459 | |||||||||
| Diluted Shares Outstanding, MM | 1,453 | |||||||||
| Equity Value Per Share | -20.96 |
What You Will Receive
- Customizable Excel Template: A fully editable Excel-based DCF Calculator featuring pre-loaded financials for Zhejiang Huahai Pharmaceutical Co., Ltd. (600521SS).
- Authentic Data: Access to historical data alongside forward-looking projections (highlighted in the yellow cells).
- Flexible Forecasting: Adjust key assumptions such as revenue growth, EBITDA%, and WACC as needed.
- Real-Time Calculations: Quickly observe how your inputs influence the valuation of Zhejiang Huahai Pharmaceutical Co., Ltd. (600521SS).
- Professional Resource: Designed for investors, CFOs, consultants, and financial analysts alike.
- User-Friendly Interface: Organized for easy navigation and comprehension, complete with step-by-step guidance.
Key Features
- Comprehensive DCF Calculator: Offers both unlevered and levered DCF valuation models tailored for Zhejiang Huahai Pharmaceutical Co., Ltd. (600521SS).
- WACC Calculator: Features a pre-formulated Weighted Average Cost of Capital sheet with adjustable input parameters.
- Customizable Forecast Assumptions: Easily adjust growth rates, capital expenditures, and discount rates.
- Integrated Financial Ratios: Evaluate profitability, leverage, and efficiency ratios specific to Zhejiang Huahai Pharmaceutical Co., Ltd. (600521SS).
- Interactive Dashboard and Charts: Visual representations of key valuation metrics for straightforward analysis.
How It Works
- Step 1: Download the Excel file.
- Step 2: Examine the pre-filled data for Zhejiang Huahai Pharmaceutical Co., Ltd. (600521SS), including historical and projected figures.
- Step 3: Modify key assumptions (highlighted in yellow) according to your analysis.
- Step 4: Observe the automatic recalculations of Zhejiang Huahai Pharmaceutical Co., Ltd.'s (600521SS) intrinsic value.
- Step 5: Utilize the results for investment decisions or reporting purposes.
Why Choose This Calculator for Zhejiang Huahai Pharmaceutical Co., Ltd. (600521SS)?
- Designed for Industry Experts: A sophisticated tool favored by analysts, CFOs, and consultants in the pharmaceutical sector.
- Accurate Data Integration: Historical and forecasted financial data for Zhejiang Huahai preloaded for precision.
- Custom Scenario Analysis: Effortlessly simulate various forecasts and assumptions for better insights.
- Comprehensive Outputs: Instantly computes intrinsic value, NPV, and critical financial metrics.
- User-Friendly Interface: Step-by-step guidance makes the process straightforward and intuitive.
Who Can Benefit from This Product?
- Investors: Gain the confidence to make informed decisions with a top-tier valuation tool.
- Financial Analysts: Save valuable time with an customizable DCF model that is ready to use.
- Consultants: Effortlessly modify the template for client reports or presentations.
- Finance Enthusiasts: Enhance your grasp of valuation methodologies through practical, real-life examples.
- Educators and Students: Utilize it as an effective learning resource in finance-related disciplines.
Overview of the Template Features
- Comprehensive DCF Model: An editable framework featuring detailed valuation calculations.
- Real-World Data: Historical and projected financials for Zhejiang Huahai Pharmaceutical Co., Ltd. (600521SS) preloaded for your analysis.
- Customizable Parameters: Modify WACC, growth rates, and tax assumptions to explore various scenarios.
- Financial Statements: Complete annual and quarterly financial breakdowns for enhanced insights.
- Key Ratios: Integrated analysis for assessing profitability, efficiency, and leverage.
- Dashboard with Visual Outputs: Dynamic charts and tables providing clear and actionable results.
Disclaimer
All information, articles, and product details provided on this website are for general informational and educational purposes only. We do not claim any ownership over, nor do we intend to infringe upon, any trademarks, copyrights, logos, brand names, or other intellectual property mentioned or depicted on this site. Such intellectual property remains the property of its respective owners, and any references here are made solely for identification or informational purposes, without implying any affiliation, endorsement, or partnership.
We make no representations or warranties, express or implied, regarding the accuracy, completeness, or suitability of any content or products presented. Nothing on this website should be construed as legal, tax, investment, financial, medical, or other professional advice. In addition, no part of this site—including articles or product references—constitutes a solicitation, recommendation, endorsement, advertisement, or offer to buy or sell any securities, franchises, or other financial instruments, particularly in jurisdictions where such activity would be unlawful.
All content is of a general nature and may not address the specific circumstances of any individual or entity. It is not a substitute for professional advice or services. Any actions you take based on the information provided here are strictly at your own risk. You accept full responsibility for any decisions or outcomes arising from your use of this website and agree to release us from any liability in connection with your use of, or reliance upon, the content or products found herein.