
|
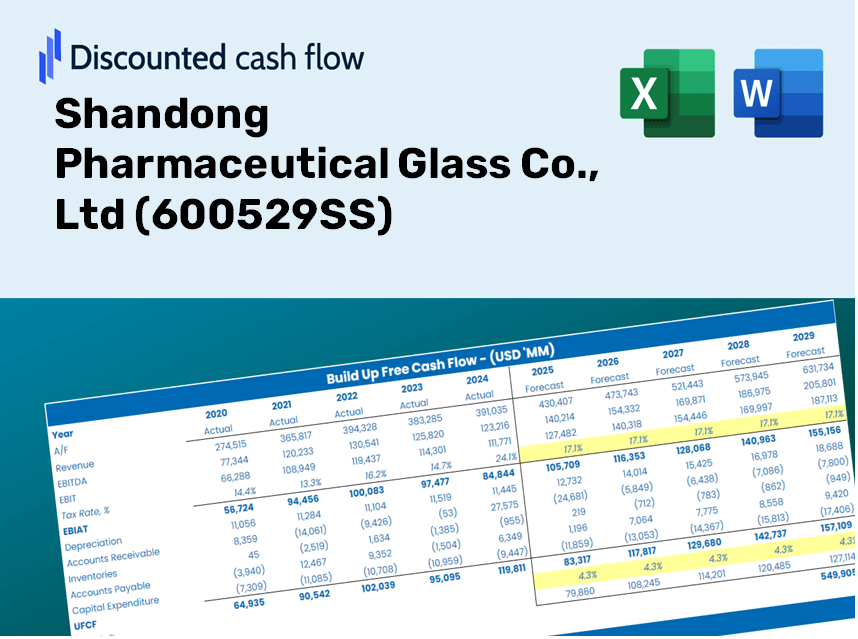
Shandong Pharmaceutical Glass Co., Ltd (600529.SS) DCF -Bewertung |
Fully Editable: Tailor To Your Needs In Excel Or Sheets
Professional Design: Trusted, Industry-Standard Templates
Investor-Approved Valuation Models
MAC/PC Compatible, Fully Unlocked
No Expertise Is Needed; Easy To Follow
Shandong Pharmaceutical Glass Co., Ltd (600529.SS) Bundle
Unser (600529S) DCF-Taschenrechner entwickelt für die Genauigkeit und ermöglicht es Ihnen, Shandong Pharmaceutical Glass Co., Ltds Bewertung mit realen Finanzdaten zu bewerten, und bietet vollständige Flexibilität, um alle Schlüsselparameter für erweiterte Projektionen zu ändern.
Discounted Cash Flow (DCF) - (USD MM)
| Year | AY1 2020 |
AY2 2021 |
AY3 2022 |
AY4 2023 |
AY5 2024 |
FY1 2025 |
FY2 2026 |
FY3 2027 |
FY4 2028 |
FY5 2029 |
|---|---|---|---|---|---|---|---|---|---|---|
| Revenue | 3,427.1 | 3,875.3 | 4,187.3 | 4,982.2 | 5,125.3 | 5,676.1 | 6,286.0 | 6,961.5 | 7,709.6 | 8,538.2 |
| Revenue Growth, % | 0 | 13.08 | 8.05 | 18.98 | 2.87 | 10.75 | 10.75 | 10.75 | 10.75 | 10.75 |
| EBITDA | 879.3 | 919.0 | 958.1 | 1,173.7 | 1,416.2 | 1,401.3 | 1,551.9 | 1,718.7 | 1,903.4 | 2,107.9 |
| EBITDA, % | 25.66 | 23.71 | 22.88 | 23.56 | 27.63 | 24.69 | 24.69 | 24.69 | 24.69 | 24.69 |
| Depreciation | 217.9 | 240.6 | 295.2 | 325.1 | 384.8 | 382.0 | 423.1 | 468.5 | 518.9 | 574.6 |
| Depreciation, % | 6.36 | 6.21 | 7.05 | 6.53 | 7.51 | 6.73 | 6.73 | 6.73 | 6.73 | 6.73 |
| EBIT | 661.4 | 678.4 | 663.0 | 848.6 | 1,031.4 | 1,019.3 | 1,128.9 | 1,250.2 | 1,384.5 | 1,533.3 |
| EBIT, % | 19.3 | 17.51 | 15.83 | 17.03 | 20.12 | 17.96 | 17.96 | 17.96 | 17.96 | 17.96 |
| Total Cash | 1,362.4 | 1,192.2 | 2,453.5 | 2,684.2 | 2,790.2 | 2,695.3 | 2,984.9 | 3,305.7 | 3,660.9 | 4,054.4 |
| Total Cash, percent | .0 | .0 | .0 | .0 | .0 | .0 | .0 | .0 | .0 | .0 |
| Account Receivables | 948.6 | 1,203.3 | 1,570.4 | 1,701.2 | 1,733.6 | 1,864.0 | 2,064.4 | 2,286.2 | 2,531.9 | 2,804.0 |
| Account Receivables, % | 27.68 | 31.05 | 37.5 | 34.15 | 33.82 | 32.84 | 32.84 | 32.84 | 32.84 | 32.84 |
| Inventories | 749.2 | 877.7 | 1,209.9 | 1,054.6 | 1,278.7 | 1,356.8 | 1,502.6 | 1,664.1 | 1,842.9 | 2,041.0 |
| Inventories, % | 21.86 | 22.65 | 28.89 | 21.17 | 24.95 | 23.9 | 23.9 | 23.9 | 23.9 | 23.9 |
| Accounts Payable | 995.8 | 1,271.7 | 1,247.0 | 1,393.7 | 650.5 | 1,502.1 | 1,663.5 | 1,842.3 | 2,040.2 | 2,259.5 |
| Accounts Payable, % | 29.06 | 32.81 | 29.78 | 27.97 | 12.69 | 26.46 | 26.46 | 26.46 | 26.46 | 26.46 |
| Capital Expenditure | -535.2 | -809.3 | -710.7 | -671.5 | -647.8 | -903.5 | -1,000.6 | -1,108.1 | -1,227.2 | -1,359.1 |
| Capital Expenditure, % | -15.62 | -20.88 | -16.97 | -13.48 | -12.64 | -15.92 | -15.92 | -15.92 | -15.92 | -15.92 |
| Tax Rate, % | 15.11 | 15.11 | 15.11 | 15.11 | 15.11 | 15.11 | 15.11 | 15.11 | 15.11 | 15.11 |
| EBITAT | 571.2 | 582.2 | 578.9 | 722.8 | 875.6 | 875.8 | 969.9 | 1,074.1 | 1,189.6 | 1,317.4 |
| Depreciation | ||||||||||
| Changes in Account Receivables | ||||||||||
| Changes in Inventories | ||||||||||
| Changes in Accounts Payable | ||||||||||
| Capital Expenditure | ||||||||||
| UFCF | -448.0 | -93.7 | -560.6 | 547.6 | -387.1 | 997.3 | 207.6 | 230.0 | 254.7 | 282.0 |
| WACC, % | 4.72 | 4.72 | 4.72 | 4.71 | 4.71 | 4.72 | 4.72 | 4.72 | 4.72 | 4.72 |
| PV UFCF | ||||||||||
| SUM PV UFCF | 1,777.8 | |||||||||
| Long Term Growth Rate, % | 3.00 | |||||||||
| Free cash flow (T + 1) | 290 | |||||||||
| Terminal Value | 16,934 | |||||||||
| Present Terminal Value | 13,450 | |||||||||
| Enterprise Value | 15,228 | |||||||||
| Net Debt | -1,065 | |||||||||
| Equity Value | 16,293 | |||||||||
| Diluted Shares Outstanding, MM | 664 | |||||||||
| Equity Value Per Share | 24.54 |
What You Will Receive
- Authentic 600529SS Financial Data: Pre-filled with Shandong Pharmaceutical Glass Co., Ltd’s historical and projected figures for accurate analysis.
- Completely Customizable Template: Effortlessly adjust key variables such as revenue growth, WACC, and EBITDA %.
- Instant Calculations: Watch the intrinsic value of Shandong Pharmaceutical Glass Co., Ltd change in real-time based on your modifications.
- Expert Valuation Tool: Tailored for investors, analysts, and consultants in need of precise DCF outcomes.
- Intuitive User Experience: Streamlined layout and straightforward guidance suitable for all skill levels.
Key Features
- Pre-Loaded Data: Shandong Pharmaceutical Glass Co., Ltd's historical financial statements and pre-filled projections.
- Fully Adjustable Inputs: Customize WACC, tax rates, revenue growth, and EBITDA margins to suit your analysis.
- Instant Results: View the intrinsic value of Shandong Pharmaceutical Glass Co., Ltd (600529SS) recalculated in real time.
- Clear Visual Outputs: Dashboard charts effectively present valuation outcomes and essential metrics.
- Built for Accuracy: A sophisticated tool designed for analysts, investors, and finance professionals.
How It Works
- Step 1: Download the prebuilt Excel template featuring Shandong Pharmaceutical Glass Co., Ltd's (600529SS) data.
- Step 2: Review the pre-filled sheets to familiarize yourself with the key metrics.
- Step 3: Modify forecasts and assumptions in the editable yellow cells (WACC, growth, margins).
- Step 4: Instantly see recalculated results, including the intrinsic value of Shandong Pharmaceutical Glass Co., Ltd (600529SS).
- Step 5: Use the outputs to make well-informed investment decisions or create detailed reports.
Why Choose This Calculator for Shandong Pharmaceutical Glass Co., Ltd (600529SS)?
- User-Friendly Design: Tailored for both novices and seasoned professionals.
- Customizable Inputs: Effortlessly adjust variables to suit your financial analysis.
- Real-Time Updates: Witness immediate changes to the valuation of Shandong Pharmaceutical Glass as you modify inputs.
- Pre-Loaded Data: Comes equipped with Shandong Pharmaceutical Glass's actual financial information for swift evaluations.
- Relied Upon by Experts: Favored by investors and analysts for well-informed decision-making.
Who Can Benefit from This Product?
- Pharmaceutical Students: Explore analytical methods and apply them to real-life data.
- Researchers: Integrate industry-standard models into your academic projects.
- Investors: Validate your hypotheses and evaluate valuation results for Shandong Pharmaceutical Glass Co., Ltd (600529SS).
- Market Analysts: Enhance your efficiency with a customizable, ready-to-use DCF model.
- Entrepreneurs: Understand the valuation techniques used for major public companies like Shandong Pharmaceutical Glass Co., Ltd (600529SS).
Contents of the Template
- Comprehensive DCF Model: An editable template featuring thorough valuation calculations.
- Real-World Data: Shandong Pharmaceutical Glass Co., Ltd's historical and projected financials preloaded for in-depth analysis.
- Customizable Parameters: Modify WACC, growth rates, and tax assumptions to explore various scenarios.
- Financial Statements: Complete annual and quarterly breakdowns for enhanced insights.
- Key Ratios: Integrated analysis for assessing profitability, efficiency, and leverage.
- Dashboard with Visual Outputs: Visual representations including charts and tables for clear, actionable conclusions.
Disclaimer
All information, articles, and product details provided on this website are for general informational and educational purposes only. We do not claim any ownership over, nor do we intend to infringe upon, any trademarks, copyrights, logos, brand names, or other intellectual property mentioned or depicted on this site. Such intellectual property remains the property of its respective owners, and any references here are made solely for identification or informational purposes, without implying any affiliation, endorsement, or partnership.
We make no representations or warranties, express or implied, regarding the accuracy, completeness, or suitability of any content or products presented. Nothing on this website should be construed as legal, tax, investment, financial, medical, or other professional advice. In addition, no part of this site—including articles or product references—constitutes a solicitation, recommendation, endorsement, advertisement, or offer to buy or sell any securities, franchises, or other financial instruments, particularly in jurisdictions where such activity would be unlawful.
All content is of a general nature and may not address the specific circumstances of any individual or entity. It is not a substitute for professional advice or services. Any actions you take based on the information provided here are strictly at your own risk. You accept full responsibility for any decisions or outcomes arising from your use of this website and agree to release us from any liability in connection with your use of, or reliance upon, the content or products found herein.