
|
INMYSHOW Digital TechnologyCo., Ltd. (600556.SS) DCF -Bewertung |
Fully Editable: Tailor To Your Needs In Excel Or Sheets
Professional Design: Trusted, Industry-Standard Templates
Investor-Approved Valuation Models
MAC/PC Compatible, Fully Unlocked
No Expertise Is Needed; Easy To Follow
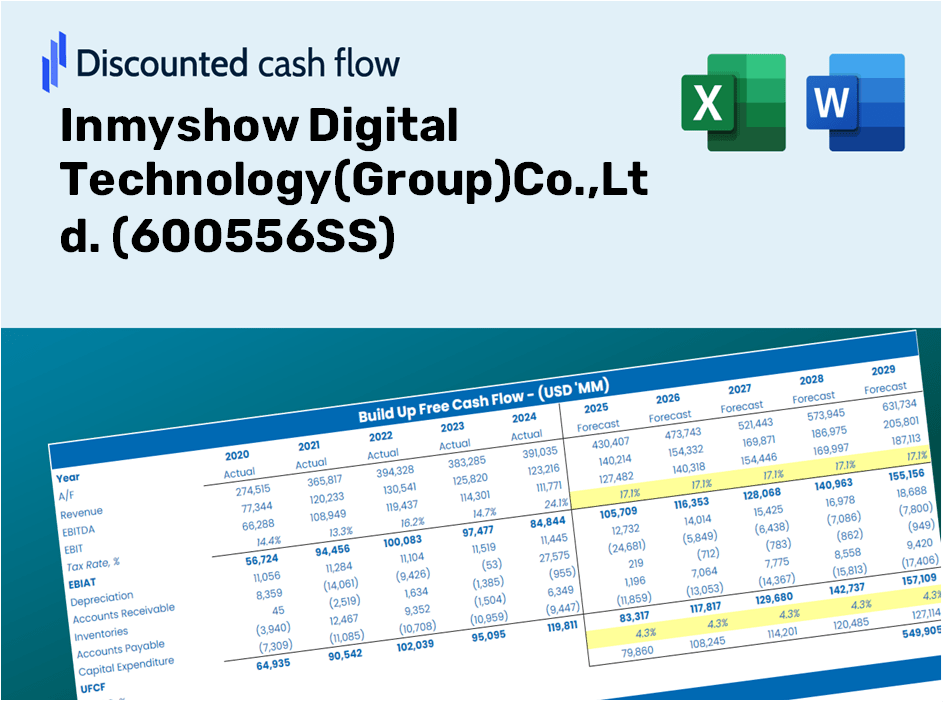
Inmyshow Digital Technology(Group)Co.,Ltd. (600556.SS) Bundle
Optimieren Sie Ihre Analyse und verbessern Sie die Präzision mit unserem DCF -Taschenrechner (600556S)! Mithilfe realer Daten von Inmyshow Digital Technology (Group) Co., Ltd. und anpassbare Annahmen ermöglichen dieses Tool Sie, die digitale Technologie der Inmyshow wie ein erfahrener Investor prognostizieren, analysieren und bewerten.
Your Benefits
- Accurate Inmyshow Data: Fully integrated financials – encompassing revenue to EBIT – derived from actual and forecasted metrics.
- Complete Customization: Modify all essential parameters (highlighted cells) such as WACC, growth %, and tax rates.
- Immediate Valuation Updates: Automatic recalibrations to assess the effects of modifications on Inmyshow's fair value.
- Flexible Excel Template: Designed for quick adjustments, scenario evaluations, and comprehensive forecasts.
- Efficient and Precise: Bypass the need to construct models from the ground up while ensuring accuracy and adaptability.
Key Features
- Customizable Forecast Inputs: Adjust essential metrics like revenue growth, EBITDA percentage, and capital expenditures.
- Instant DCF Valuation: Automatically computes intrinsic value, NPV, and additional financial metrics.
- High Precision Accuracy: Leverages Inmyshow Digital Technology's actual financial data for credible valuation results.
- Effortless Scenario Analysis: Easily explore various assumptions and compare their outcomes.
- Time-Efficient Solution: Remove the hassle of constructing complex valuation models from the ground up.
How It Works
- 1. Access the Template: Download and open the Excel file featuring Inmyshow Digital Technology(Group) Co., Ltd.'s preloaded data.
- 2. Modify Assumptions: Adjust critical inputs such as growth rates, WACC, and capital expenditures as needed.
- 3. Analyze Results in Real Time: The DCF model automatically computes intrinsic value and NPV based on your inputs.
- 4. Evaluate Scenarios: Assess various forecasts to explore different valuation possibilities.
- 5. Present with Assurance: Deliver professional valuation findings to enhance your decision-making process.
Why Opt for This Calculator?
- Designed for Experts: A sophisticated tool utilized by financial analysts, CFOs, and industry consultants.
- Accurate Data: Inmyshow Digital Technology(Group) Co., Ltd.’s historical and projected financials are preloaded for precision.
- Flexible Scenario Analysis: Easily test various forecasts and assumptions to evaluate different outcomes.
- Insightful Outputs: Automatically computes intrinsic value, NPV, and essential financial metrics.
- User-Friendly: Step-by-step guidance ensures a smooth navigation through the entire process.
Who Can Benefit from Inmyshow Digital Technology (600556SS)?
- Investors: Accurately assess the fair value of Inmyshow Digital Technology before making investment choices.
- CFOs: Utilize a professional-grade DCF model for comprehensive financial reporting and analysis related to Inmyshow Digital Technology.
- Consultants: Effortlessly customize the template for client valuation reports focused on Inmyshow Digital Technology.
- Entrepreneurs: Acquire insights into the financial modeling practices employed by leading technology firms.
- Educators: Employ this resource as a teaching aid to illustrate valuation methodologies relevant to Inmyshow Digital Technology.
Contents of the Template
- Pre-Filled DCF Model: Inmyshow Digital Technology(Group) Co., Ltd.'s financial data preloaded for immediate application.
- WACC Calculator: Comprehensive calculations for Weighted Average Cost of Capital.
- Financial Ratios: Assess Inmyshow's profitability, leverage, and operational efficiency.
- Editable Inputs: Modify assumptions such as growth rates, profit margins, and CAPEX to suit your scenarios.
- Financial Statements: Annual and quarterly reports provided for thorough analysis.
- Interactive Dashboard: Easily visualize essential valuation metrics and outcomes.
Disclaimer
All information, articles, and product details provided on this website are for general informational and educational purposes only. We do not claim any ownership over, nor do we intend to infringe upon, any trademarks, copyrights, logos, brand names, or other intellectual property mentioned or depicted on this site. Such intellectual property remains the property of its respective owners, and any references here are made solely for identification or informational purposes, without implying any affiliation, endorsement, or partnership.
We make no representations or warranties, express or implied, regarding the accuracy, completeness, or suitability of any content or products presented. Nothing on this website should be construed as legal, tax, investment, financial, medical, or other professional advice. In addition, no part of this site—including articles or product references—constitutes a solicitation, recommendation, endorsement, advertisement, or offer to buy or sell any securities, franchises, or other financial instruments, particularly in jurisdictions where such activity would be unlawful.
All content is of a general nature and may not address the specific circumstances of any individual or entity. It is not a substitute for professional advice or services. Any actions you take based on the information provided here are strictly at your own risk. You accept full responsibility for any decisions or outcomes arising from your use of this website and agree to release us from any liability in connection with your use of, or reliance upon, the content or products found herein.